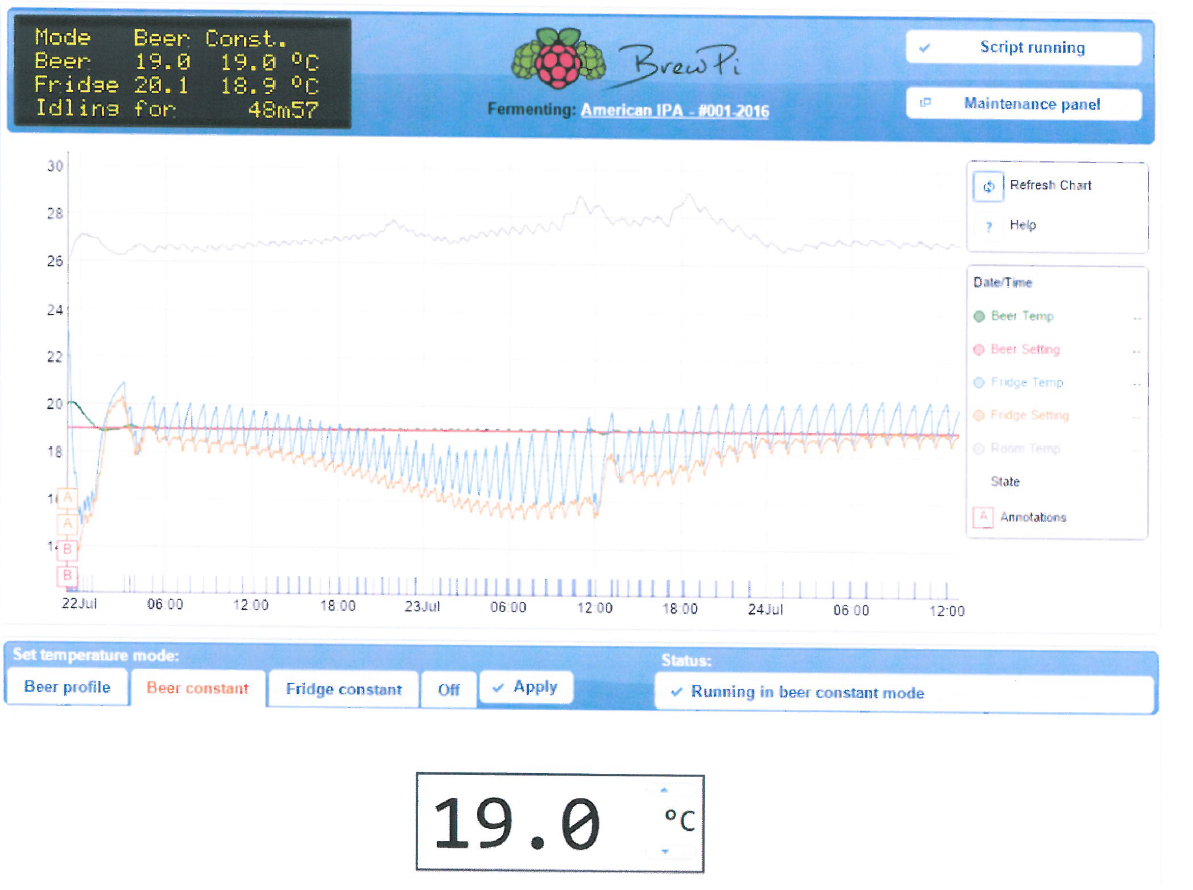
I need some help to understand the loggraph in the Brewpi, and ses if it’s telling me something about if the fermentation process have started or not.
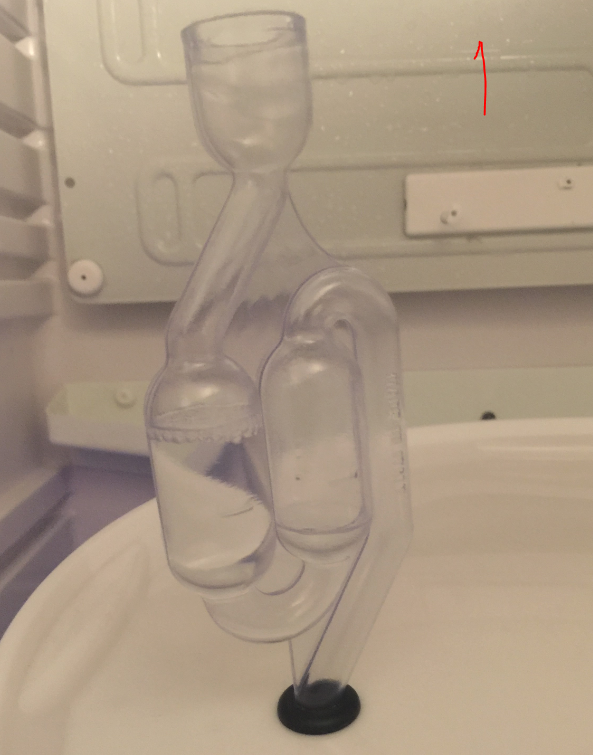
After over 60 hours from brewday, I do not have any visible sign of bubbles, but I could smell alote of citrus as it a American IPA. after 12 hour it was some pressure inside, and some smal bobbles, and in that time the graph show something.
Could I read something from the graph about the fermentation process, is it heat inside the worth or something?
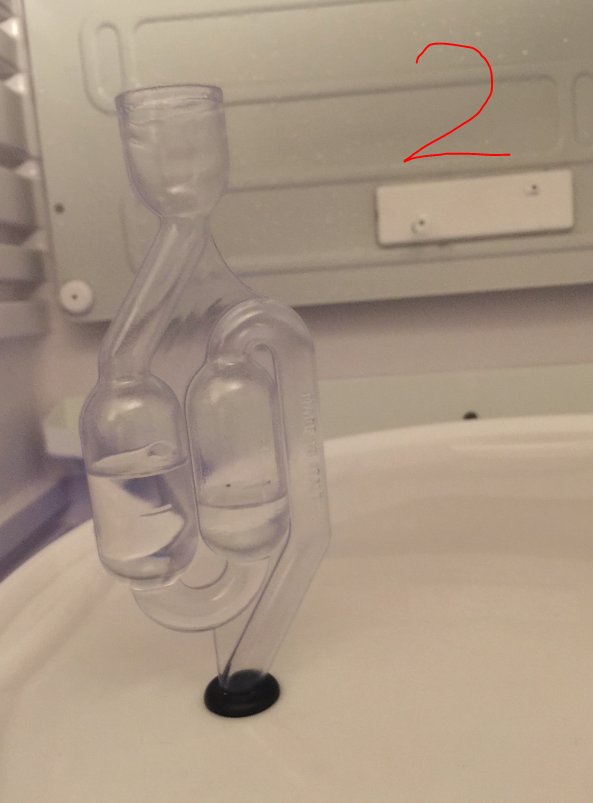
The picture #1 is from the 22 july, and picture #2 is from 23 july
I think the temperature curve looks a bit weird, but then again, lots of factors can influence this (what kind of fridge it is, how much beer you have in there, which yeast it is etc.)
I don’t think you should trust in bubbles - maybe your fermenter is leaking air/co2 somewhere.
Best test - if you have a tap on the fermenter - try the beer, see if it’s wort or if it’s beer
The only way to tell if fermentation is going is via gravity readings. Pull a sample and compare the gravity readings to the OG and see where you are at.
Thank you guys for reply. I measure the FG today and it says 1.020, and the OG was 1.060.(after 93 hour now)
So it’s alive in there, and there are some leaks in the fermenter.
I was just curious if it could read something from the graph, if it’s some heat from the fermenter and so on.
For some times ago a was reading a post here that someone have done a hack with a brewometer, so you can read the SG from the BrewPi graph, and I’ll try this one out some days, it seams to be a nicew handy tolls during the preocess.