My very basic experience with the relay controllers, is I have 4x and 4x show up but if I disconnect 3x so I can isolate and identify, all 4x still how up under the Blocks > Services page. If possible, and if someone is willing I would like to learn from the group for how and what they have setup in their systems under the new software so I can learn from you guys for how you have been integrating and testing the new software. TIA.
Will a re-fresh of the block/page or a reboot of the brewpi not show you only the connected devices? I had notes of the ID numbers of each of by relay control boards and of the ports each things was connected to from when I initially assembled my fridges.
My graphs have all just stopped loading. status in brewblox_ctl is showing all services as up and I’m still getting values for individual blocks. I’m guessing the history service may have fallen over but isn’t showing as down. Whats the best way to check and give you useful info on what went wrong @Elco and @Bob_Steers? Are there logs that would be useful? Is the easiest way for me to get things working again just stop and restart everything with brewblox_ctl?
brewblox-ctl log will do a full dump, and offer to do a termbin upload.
Meanwhile, some steps you could take to spot errors are:
- force refresh the page if you’ve updated recently, to avoid browser cache issues (ctrl+f5).
- check the network tab in your browser’s developer tools (ctrl+shift+I in chrome/firefox). When refreshing a page with graphs in it, does it have any failed requests?
- if you run
docker-compose ps, what is the up time for the history / influx services? If they’re much shorter than the others, it means the service crashed and restarted. -
docker-compose logs influx historywill print the logs for just the influx and history services. - (advanced)
docker-compose exec influx influxwill bring up the native InfluxDB CLI, if you suspect missing / malformed data.
Logs are here. I notice there’s memory warnings from eventbus. Possible memory leak?
ctrl + shift + r didn’t help.
No errors in the console. No failed network requests.Though the request to _changes on the data store seems to be remaining open. Not sure if that’s just streaming data.
docker-compose ps doesn’t include the uptime. Only shows that everything is up (including influx & history).
Warnings in logs for influx & history:
history_1    | /usr/local/lib/python3.7/site-packages/aioinflux/compat.py:11: UserWarning: Pandas/Numpy is not available. Support for
'dataframe' mode is disabled.
history_1    |   warnings.warn(no_pandas_warning)
and
history_1    | /usr/local/lib/python3.7/site-packages/brewblox_service/events.py:240: UserWarning: Connection error in <EventListener
for "eventbus">: <class 'ConnectionRefusedError'>:[Errno 111] Connect call failed ('172.22.0.5', 5672)
history_1    |   warnings.warn(f'Connection error in {self}: {type(ex)}:{ex}')
Guessing they’re not critical, given they’re just listed as warnings.
I’ve not dived into the InfluxDB CLI yet in case there’s enough info above.
Worth nothing this all started happening a few hours ago. Around 10:30 UTC/local. Graphs were displaying fine first thing this morning.
‘docker ps’ shows the up time
pi@raspberrypi:~/brewblox $ docker-compose ps
        Name                      Command               State                    Ports
--------------------------------------------------------------------------------------------------------
brewblox_datastore_1   tini -- /docker-entrypoint ...   Up      4369/tcp, 5984/tcp, 9100/tcp
brewblox_eventbus_1    docker-entrypoint.sh rabbi ...   Up      25672/tcp, 4369/tcp, 5671/tcp, 5672/tcp
brewblox_history_1     python3 -m brewblox_history      Up      5000/tcp
brewblox_influx_1      /entrypoint.sh influxd           Up      8086/tcp
brewblox_mdns_1        python3 -m brewblox_mdns         Up
brewblox_spark-one_1   python3 -m brewblox_devcon ...   Up      5000/tcp
brewblox_traefik_1     /traefik -c /config/traefi ...   Up      0.0.0.0:443->443/tcp, 0.0.0.0:80->80/tcp
brewblox_ui_1          nginx -g daemon off;             Up      80/tcp
pi@raspberrypi:~/brewblox $ docker ps
CONTAINER ID        IMAGE                                     COMMAND                  CREATED             STATUS              PORTS                                      NAMES
cc10a679cb4e        brewblox/brewblox-history:rpi-edge        "python3 -m brewblox…"   29 minutes ago      Up 29 minutes       5000/tcp                                   brewblox_history_1
0aea32f1ec29        brewblox/brewblox-devcon-spark:rpi-edge   "python3 -m brewblox…"   29 minutes ago      Up 29 minutes       5000/tcp                                   brewblox_spark-one_1
5a6934cc06ab        arm32v6/rabbitmq:alpine                   "docker-entrypoint.s…"   29 minutes ago      Up 29 minutes       4369/tcp, 5671-5672/tcp, 25672/tcp         brewblox_eventbus_1
ff13495ed1f7        arm32v6/traefik                           "/traefik -c /config…"   29 minutes ago      Up 29 minutes       0.0.0.0:80->80/tcp, 0.0.0.0:443->443/tcp   brewblox_traefik_1
db6f87701464        treehouses/couchdb                        "tini -- /docker-ent…"   29 minutes ago      Up 29 minutes       4369/tcp, 5984/tcp, 9100/tcp               brewblox_datastore_1
2f936b96492e        brewblox/brewblox-mdns:rpi-edge           "python3 -m brewblox…"   29 minutes ago      Up 29 minutes                                                  brewblox_mdns_1
122a59cb2710        brewblox/brewblox-ui:rpi-edge             "nginx -g 'daemon of…"   29 minutes ago      Up 29 minutes       80/tcp                                     brewblox_ui_1
63de526cd0f2        influxdb                                  "/entrypoint.sh infl…"   29 minutes ago      Up 29 minutes       8086/tcp                                   brewblox_influx_1
Thanks. All have been up 6 days.
Datastore indeed keeps an open connection to check for remote changes. If you have two pages open, you’ll see changes replicate.
The history and connection error warnings are to be expected. Our Influx client library has an optional dependency on the (very heavy) pandas / NumPy libraries.
The Spark service starts faster than the RabbitMQ eventbus, and has to retry its connection a few times.
In your logs, I do see the eventbus complaining about memory usage. If you run docker stats or htop, does it show something hogging all your RAM?
Edit: if RAM is full, or eventbus is the culprit, you can try restarting the eventbus with docker-compose restart eventbus. This may cause normal data publishing to resume.
docker stats has 0 for everything in memory. htop seems to be showing rabbitmq eating 40% memory and going in to swap
Best restart the eventbus then, and check whether the issue persists. (docker-compose restart eventbus)
Thanks. Getting data back in the graphs now but looks like it’s lost the datapoints during the period while rabbitmq was unhappy.
Publishing data points indeed is a fire and forget action for the spark service. That way we can keep as much as possible working if one thing fails.
I’ll do some digging in RabbitMQ configuration, see whether I can improve behavior somewhat.
Thanks for the help!
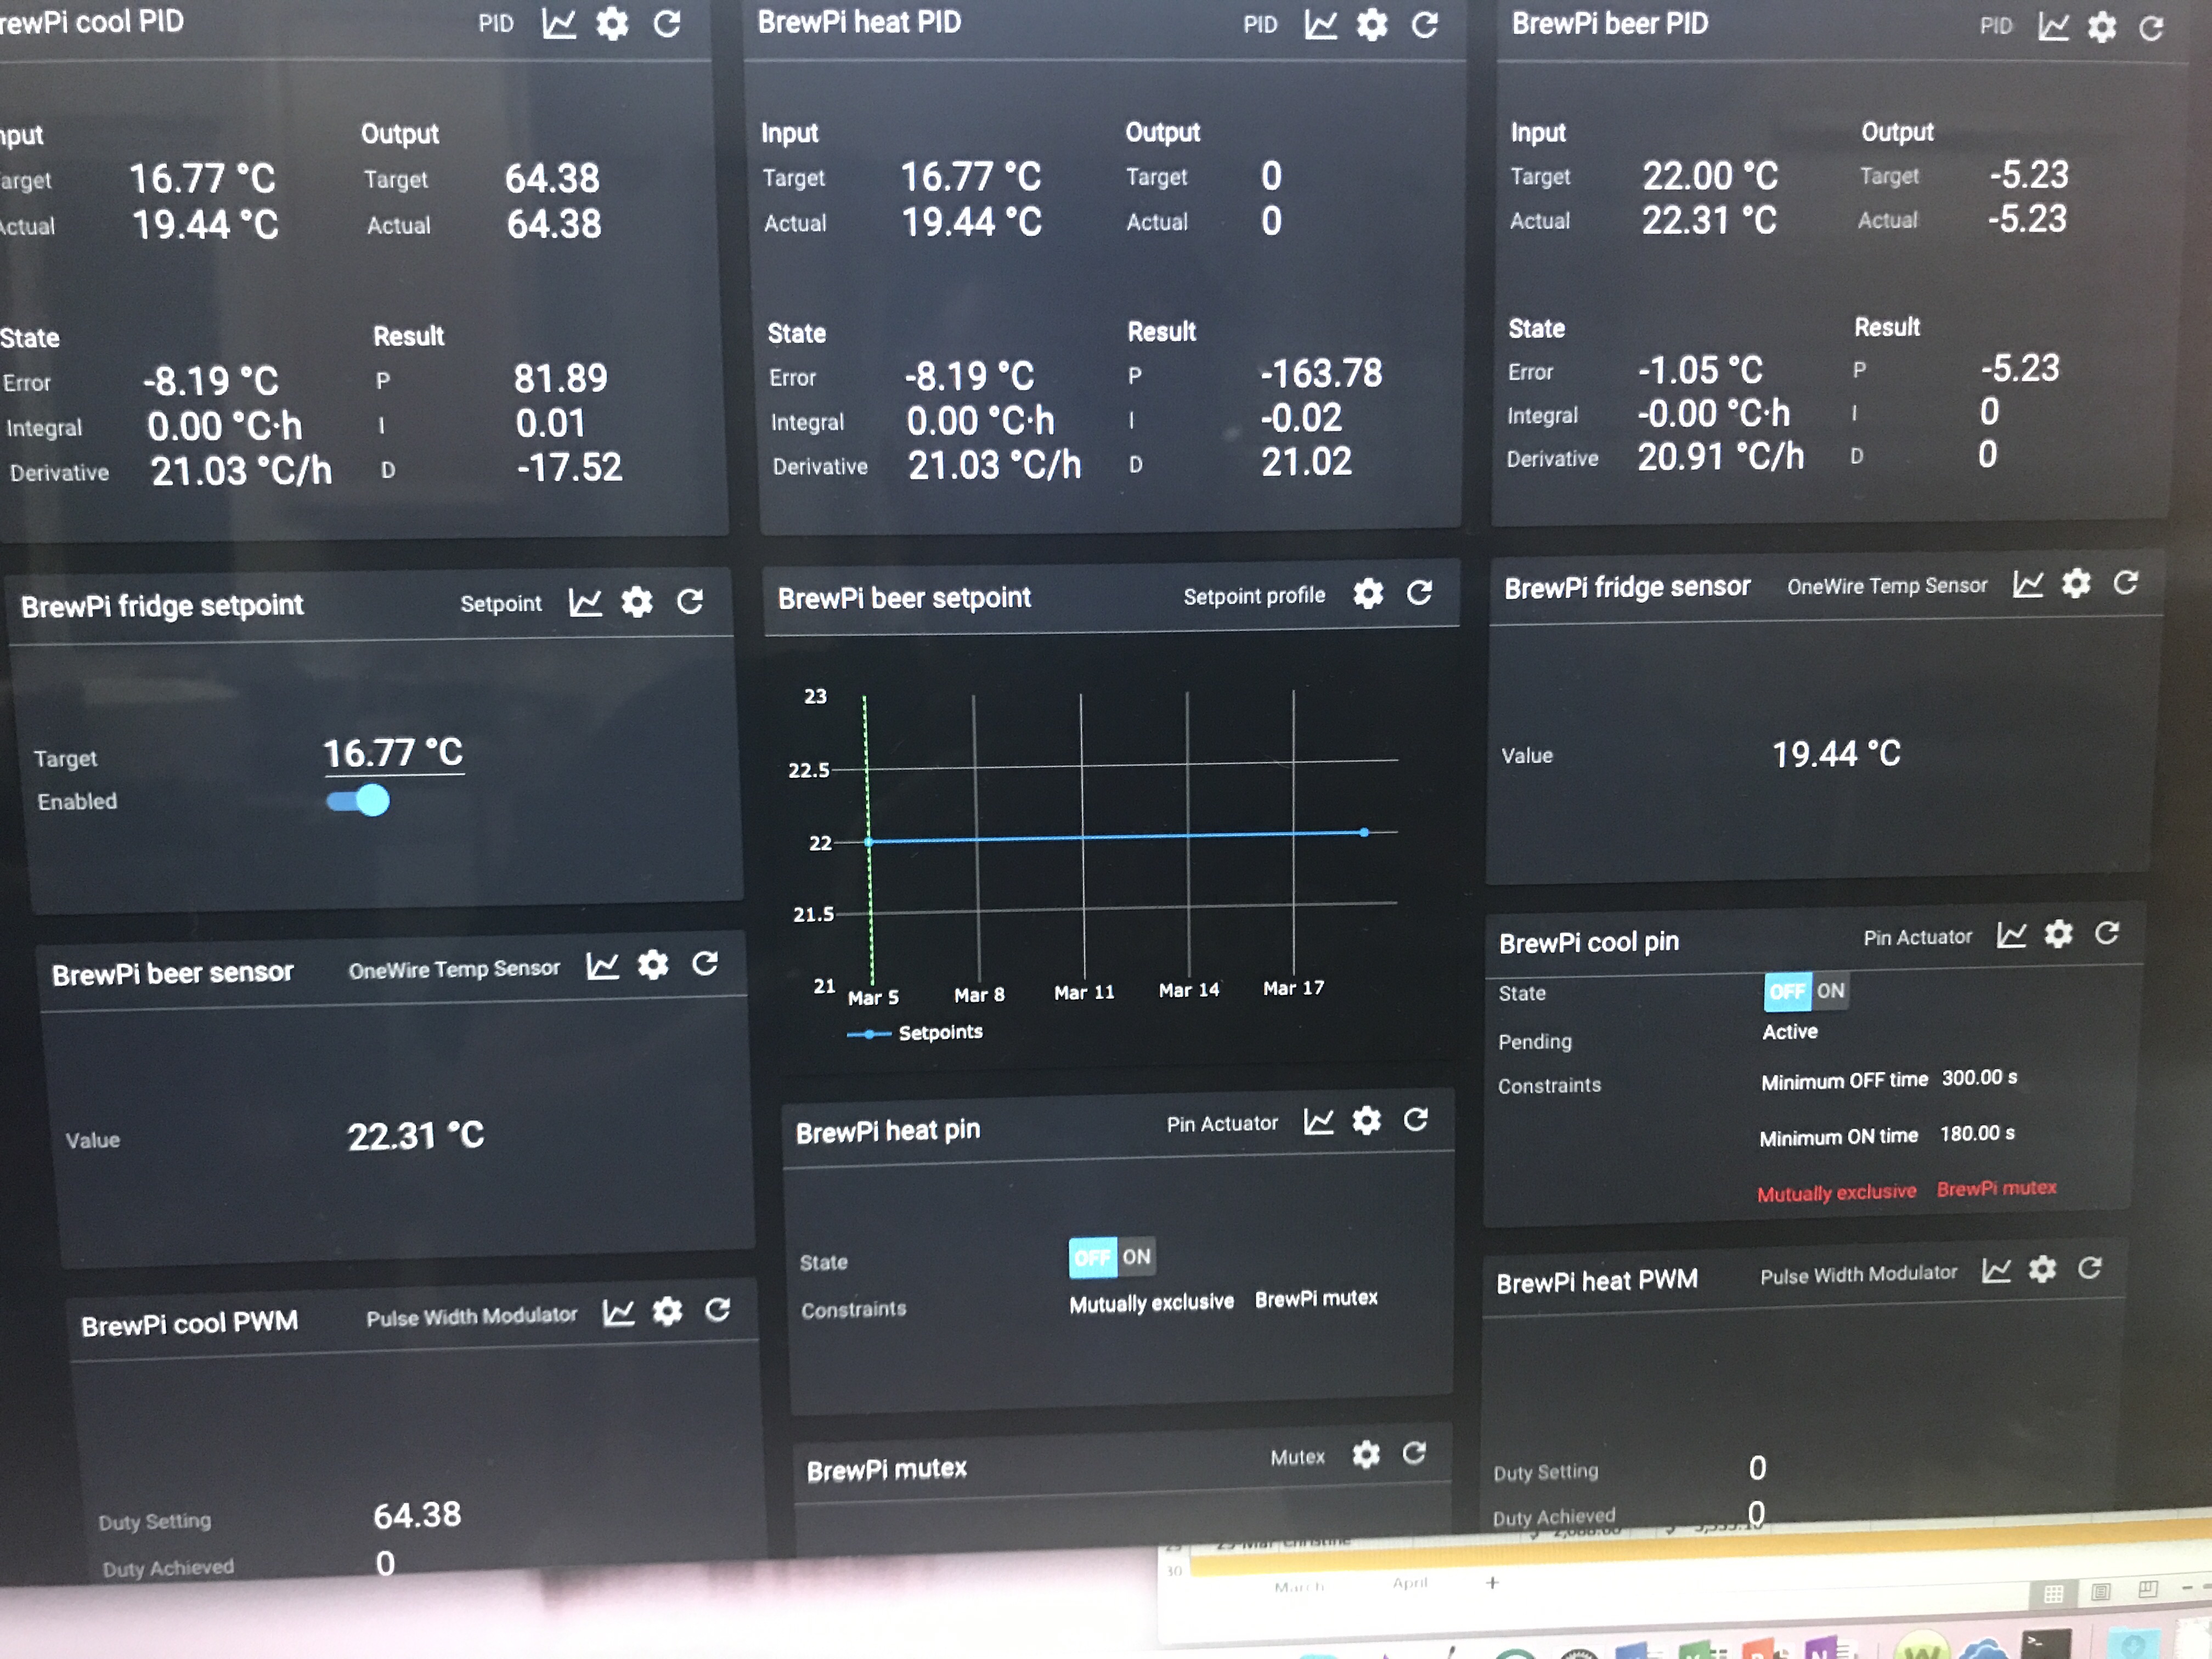
Hello. Another more feature request. Again, not a high priority one. Would it be possible to indicate blocks with an output to shown as inactive if that output is not used? e.g. if I have both a profile setpoint and regular setpoint for my beer, the regular setpoint is shown as inactive whilst my setpoint pair is using my profile setpoint and visa versa. There might be other suitable ways of indicating when a block isn’t in use instead.
Sorry. Another feature request. The profile block doesn’t seem to have any indicator where along the profile its up to. Would it be possible to add a vertical line or other marker to track that?
First issue (displaying if output is not used) is something semi-related to some other features we’re working on (displaying the chain of which block is driving what). We can have a look at also improving UX here when we’re implementing that.
I think the second one should be pretty straightforward.
Could you please make an issue for both on github, then we’ll see where and how we can schedule them.
Sorry. Just got home. Are these both best in the -ui repo?
Yes, they’re both UI issues.