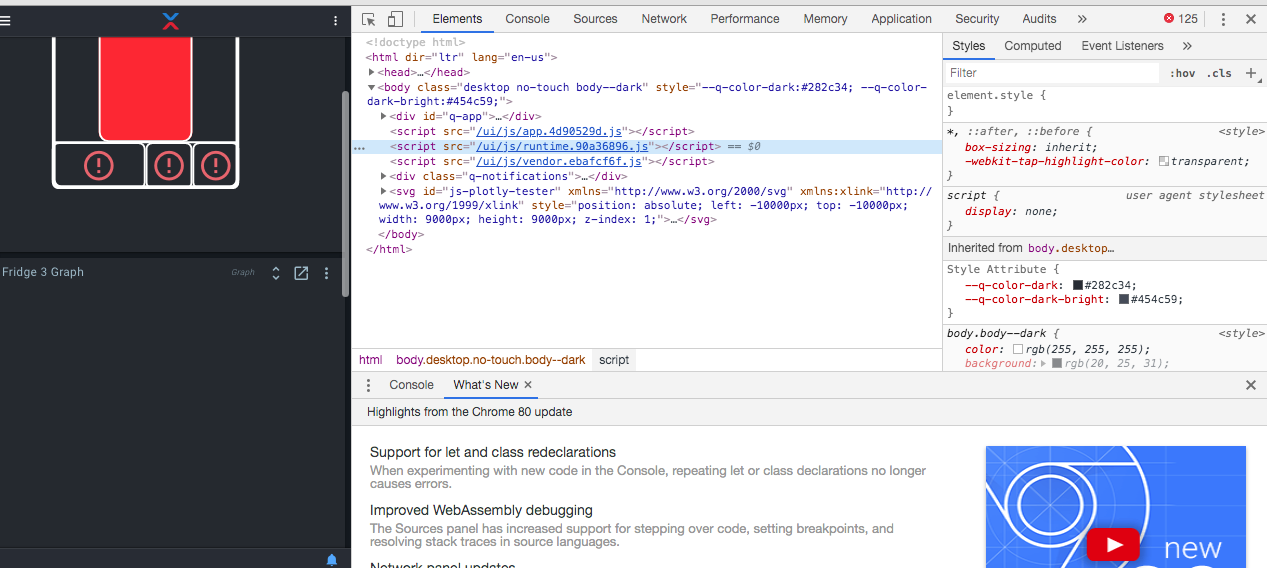
Could be the local cache in the browser and the backend being out of sync.
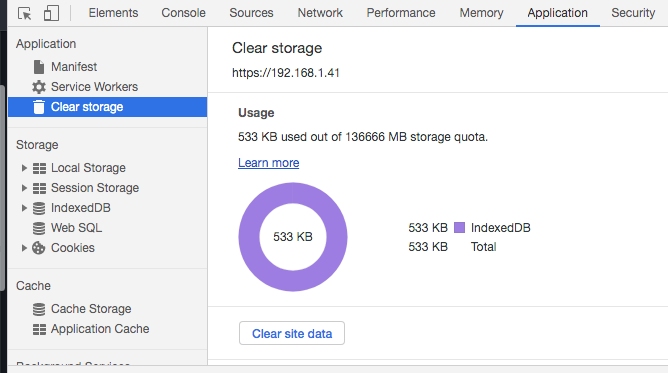
Hit F12, go to the Application tab, and look for Clear storage.
Ok found it
Maybe that wasn’t for me?
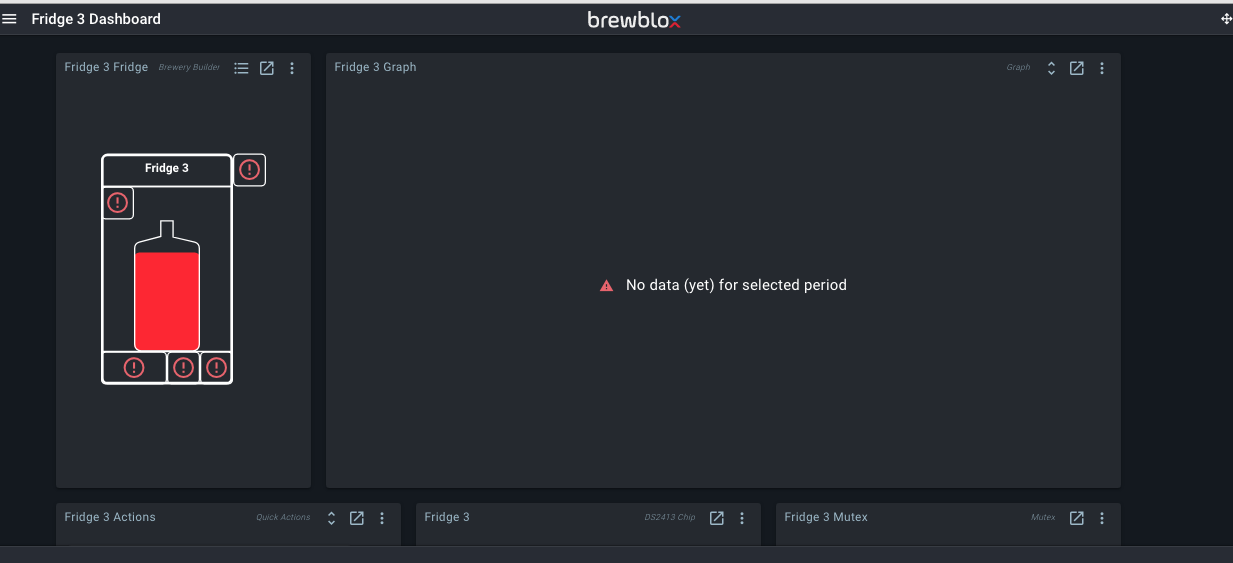
It is online, when the browser is selected the page displays as normal with the exception that is a noticeable delay before the sensor readings change from the exclamation mark to the temp readings. It is the same with Chrome and Safari.
(Updated)
I have unplugged and replugged all the one wire connections, after about 8hrs so far so good, not noticed any anomalies with the pi display.
There is still around a five second delay when opening the webpage until the values of the temp sensors are displayed, can’t say I noticed that before?
Regards
You may benefit from running brewblox-ctl disable-ipv6, and then restarting your services.
If you still see delays in the UI, could you please run ctl log again?
We recently switched to services pushing blocks to the eventbus, instead of to the UI directly. This let us implement service auto-discovery, and was required for development of the automation service.
There are some caching tricks along the way to prevent what you’re seeing: the UI loads, and has to wait for the next push of block data.
Hi,
The brewblox-ctl disable-ipv6 command doesn’t appear to have resolved it.
Thanks
That’s indeed an issue unrelated to ipv6. Does the problem persist after refreshing the page?
Yes seems to have although the spark also re-booted so difficult to say.
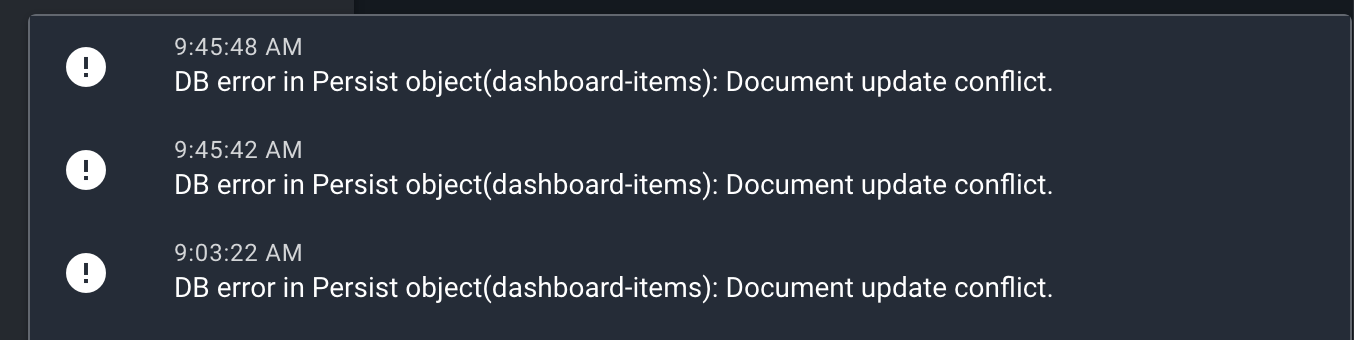
Datastore conflicts are strictly between the UI and the datastore, so a Spark reboot would not matter.
I’ll add an issue to improve recovery from datastore conflicts.
1 Like
Cool
Also Bob i’m still seeing loads of timeouts even after the IPV6 disable, I’m not sure if i have something at home thats interfering with my wifi signal though that may be causing this. But just for reference.

Those look like issues with the controller, likely the same as what pennengr is experiencing. What percentage memory use does your LCD show?
Theres two percentage numbers in the top right one fluctuates between 78%-79% the other stays constant at 83%
1 Like
I don’t use chrome. on a Mac, use safari.
FYI - three Spark reboots in the past 5-10 minutes (no web interface open).
I’ll try if I can reproduce it using your EEPROM binary. But this has been very hard to reproduce. I think it is related to the local network somehow too.
Noticed an overlap on the x axis labels on my right fermenter beer profile. You’ll notice the dates overlap into the legend on the ferment right profile but not on the ferment left profile the one above. This is on safari on iOS mobile. iPhone 11!
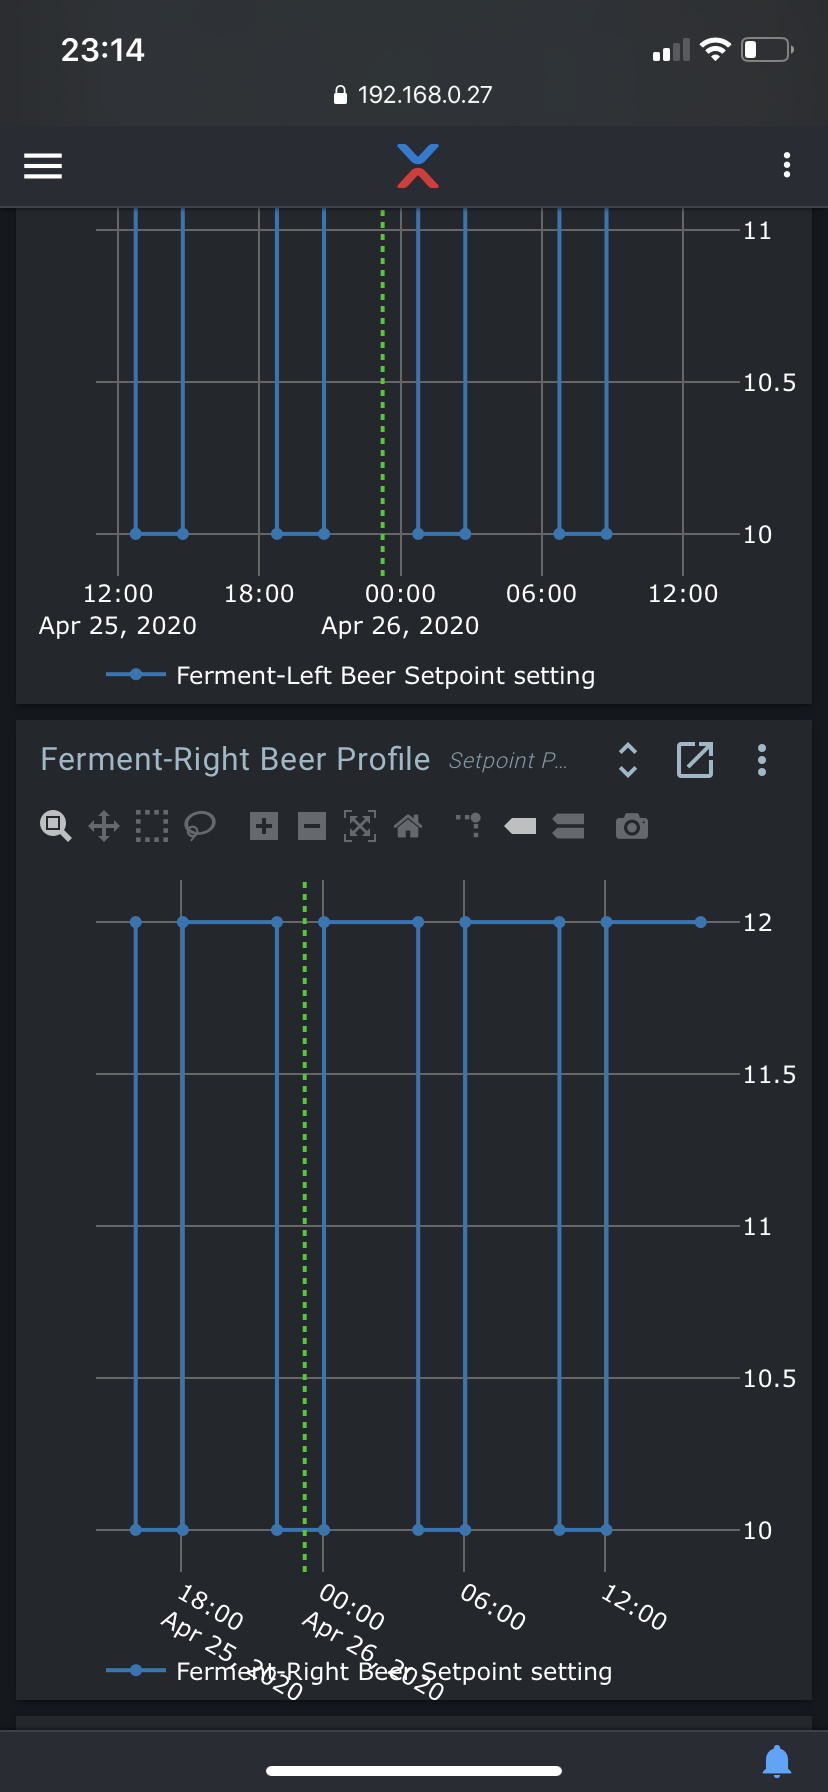
Interesting that the bottom apparently reached some cut-off point, while the top one is rendering more labels.
While mildly annoying, I’m afraid that we’re not likely to try and fix this behavior. Legenda and axis label positioning is handled by the Plotly.js library.
We configure whether the legenda / labels are rendered, but not how and where. Completely discarding them on narrow screens would not be an improvement either.