- User guides: https://brewblox.netlify.app/
- Previous release notes: https://brewblox.netlify.app/user/release_notes.html
- Project board: https://github.com/orgs/Brewblox/projects/1
- Code repositories: https://github.com/Brewblox
Brewblox release 2020/06/15
Firmware release date: 2020/06/07
While evaluating what will be next for the automation service, we spent this release improving the internals of Brewblox.
The biggest change is that we decided to use a different protocol for eventbus messages (used to publish history data).
The short version is that the MQTT protocol is more lightweight, and can be used by external scripts and services without exposing the 5672 port.
The details of the how and why are described here and here.
The existing protocol will be supported until 2020/09/15.
After that, services and scripts that publish history data will have to use MQTT to be compatible.
We updated the boilerplate repository and the script tutorials to provide code examples.
The immediate advantage is that Brewblox needs one less Docker container: the emitter service was used to convert AMQP events to a protocol usable by the UI.
The UI can now subscribe directly to MQTT events, eliminating the need for the emitter service.
Brewblox server changes
- (feature) Brewblox now uses the MQTT protocol for history events. AMQP is still supported, but will be disabled in three months.
- (improve) Removed the emitter service.
- (improve) Significantly reduced CPU usage in the Spark service when communicating with the controller.
- (improve) Spark page behavior (list/relations, sorting mode) is no longer shared for all users of the UI.
- (improve) Reduced output noise during brewblox-ctl setup
- (improve) Improved handling for the Pump part:
- If no block linked, it will toggle manually, and use part settings to remember on/off.
- If a block is linked, but does not exist, it will show an error.
- If a digital actuator is linked, it will toggle the block when clicked.
- If a PWM is linked, it will show a slider dialog when clicked.
- (improve) Reduced line stretching when the carboy is scaled.
- (feature) Timestamp formatting when exporting history data to CSV is now configurable (nanoseconds, milliseconds, seconds, ISO 8601-string).
- (feature) The troubleshooter now shows an “update firmware” button when firmware is incompatible.
- (fix) Fixed too much config being imported when adding a block to the graph widget.
Changes (automation)
- The Webhook action now has a “Try it” button in the template editor.
Firmware changes
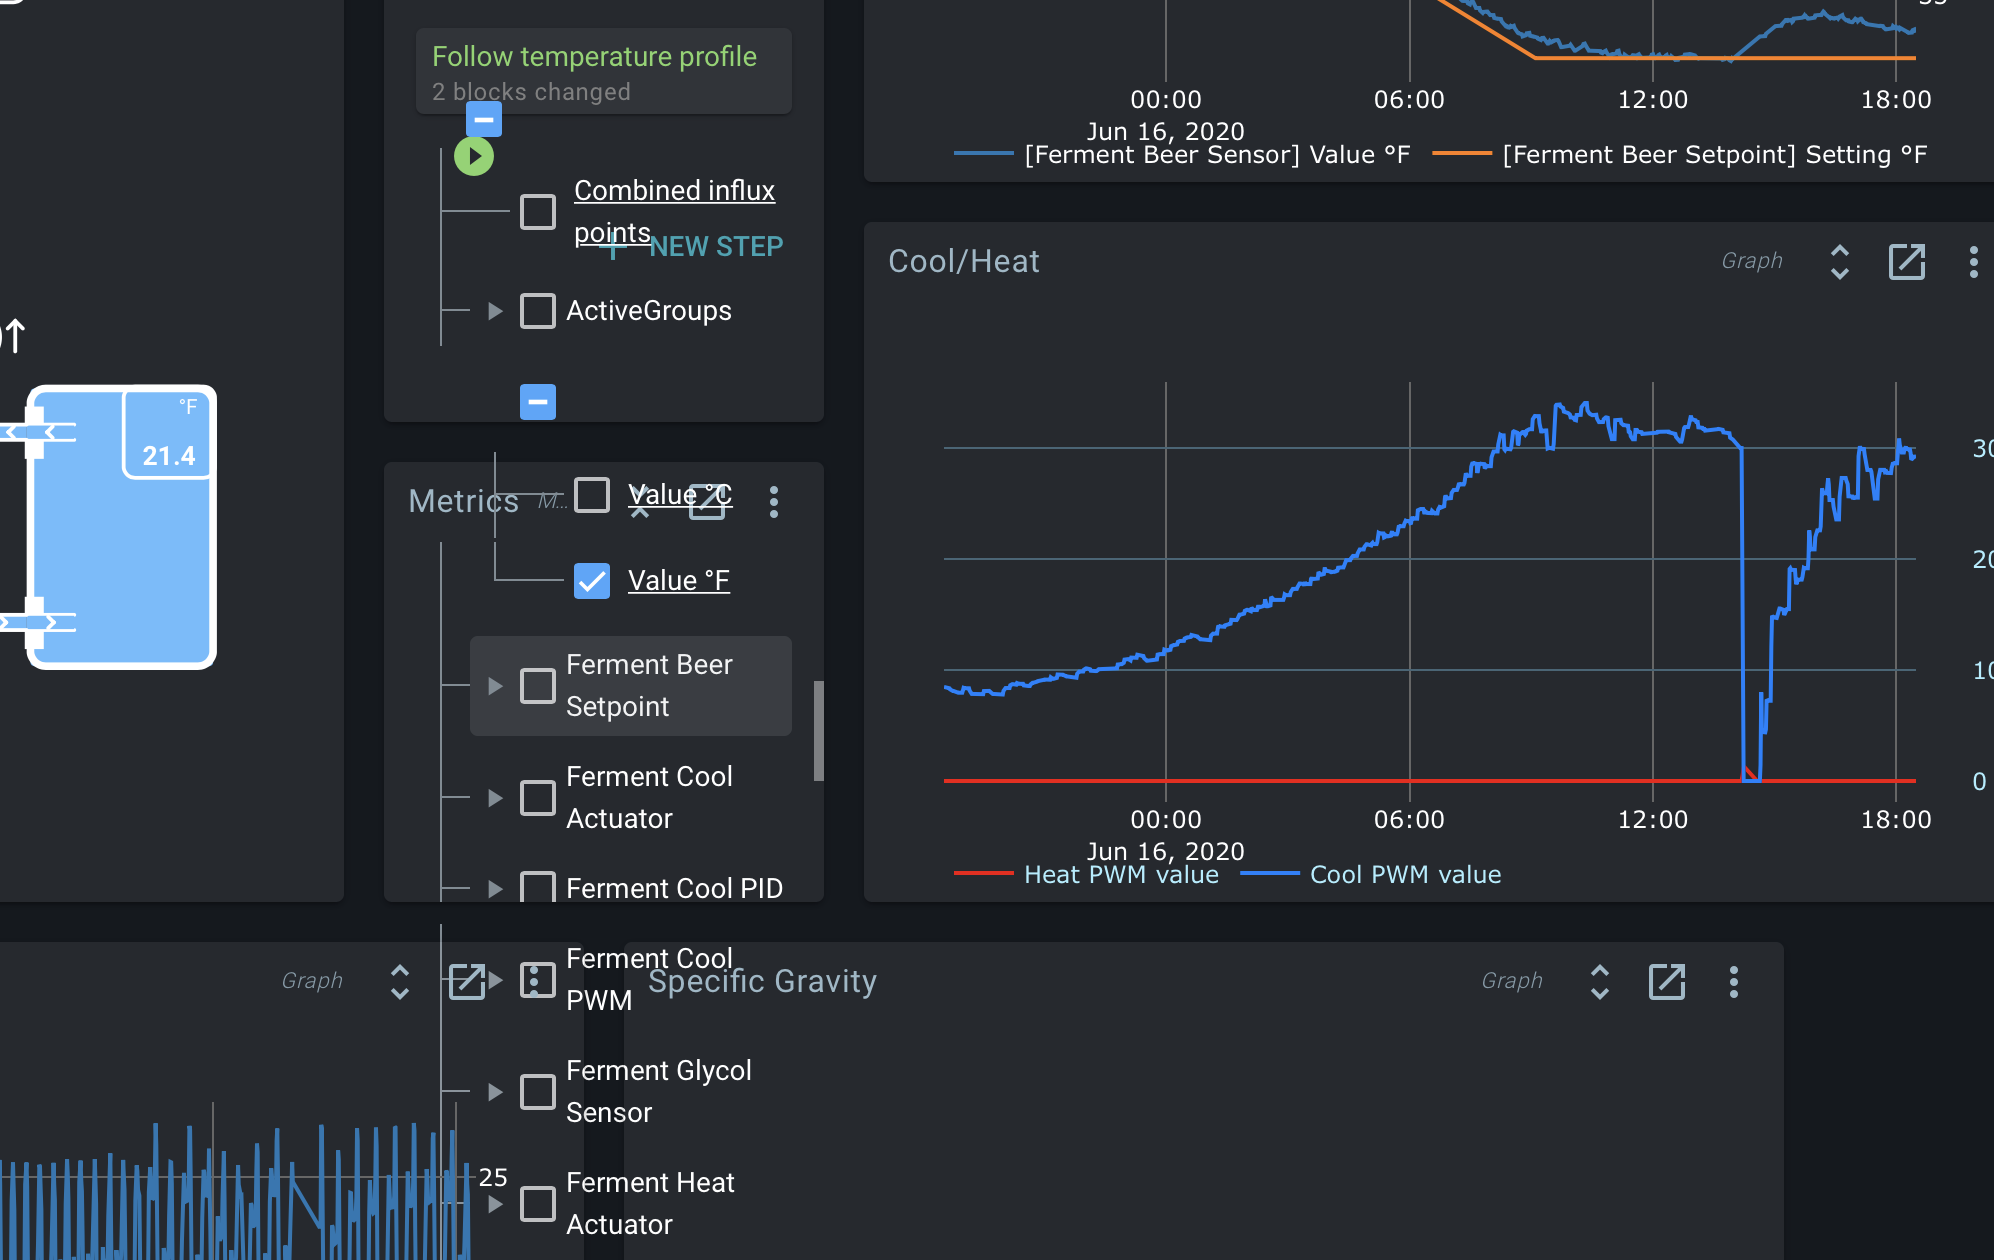
Various improvements in the PID algorithm to reduce overshoot:
- The integral part of the PID is now increased by (P + D) / Ti every second, instead of P/Ti. This will make the integral increase slower when moving quicker towards the setpoint, which reduces overshoot caused by the integral increasing too quickly.
- The derivate is now always applied. In the previous release, it was only applied when it would reduce the output. Applying it always makes the calculation more balanced and can correct a move away from setpoint early.