With this release, the Spark simulator is no longer based on the Spark 3.
Some of the changes are immediately noticeable:
The Spark Sim Display now uses the Spark 4 display library.
The simulator no longer pretends it only has 2kB EEPROM.
The simulator no longer has a Spark 3 Pins block.
The simulator no longer automatically “discovers” temp sensor and DS2408/DS2413 blocks.
Other changes are still in progress. A simulated OneWire GPIO Module block will be included in a future release.
If you already have a simulator service, you will need to reload its active blocks from a backup.
Block backups are generated automatically on a daily basis, and can be accessed from Admin → Services → {service name} → Controller backups.
Changes
(feature) The Spark sim has been updated.
(feature) The Spark Sim Display widget now shows the Spark 4 display.
(feature) Reworked constraints to be more straightforward.
(feature) The Balancer and Mutex block now show an overview of clients and potential clients.
(improve) The firmware update dialog now replaces the “flash” button with “close” if the flash was successful.
(improve) Spark backups are now sorted to display the latest first.
(improve) The Claims field in blocks now lets you navigate to all blocks in the chain.
(fix) Builder flows are now updated correctly when an actuator linked to an L-Valve changes state.
(fix) Resolved various system problems if IPv6 was disabled in the kernel.
(fix) Fixed an issue where the PID integral could reach the limits of the number type used to store it.
(deprecate) brewblox-ctl no longer supports Python 3.6 (last seen in Ubuntu 18.04).
(deprecate) brewblox-ctl no longer automatically adds the automation-ui service if an automation service was detected.
Released a brewblox-ctl update that bumps the Victoria Metrics database version. This new version includes a fix for the bug where graph data doesn’t always show up.
Updated to this release last night and all is working well.
I found a new behavior that is a bit strange on the UI front.
When I enable a setpoint profile, the system is controlling all actuators as it should, however a few things are off on the UI.
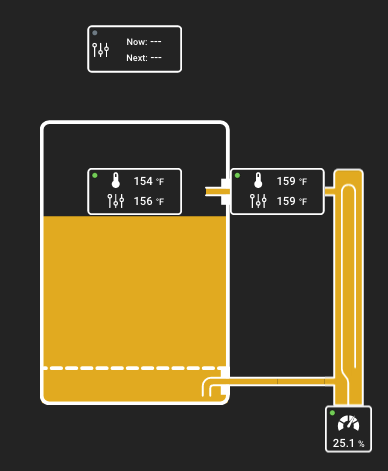
The profile block in the Brewery Builder widget updates to show the correct values for Now and Next
The rest of the blocks in the Brewer Builder widget get “–” instead of their applied setting value, but show there measured value
The corresponding display blocks on the Spark Display also get “–”
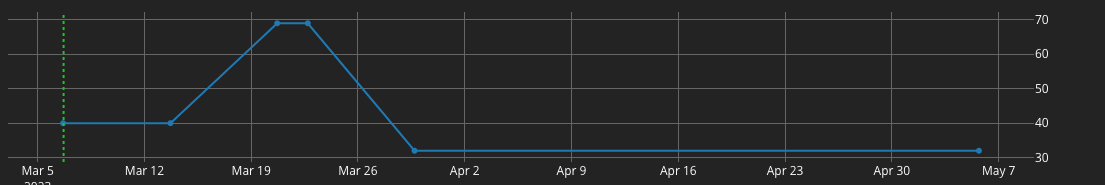
The graph stops recording those values as well, but shows the correct (or perhaps most recent?) value underneath the graph. When I turn off the setpoint profile, the graph connects the last graphed value with the current one.
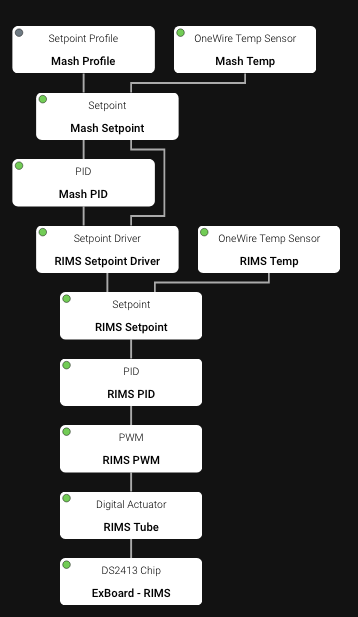
The RIMS PID shows claimed but inactive
In this case, I have the setpoint profile driving the mash setpoint, which drives the RIMS setpoint.
I get the same behavior on the cold side of things as well.
It’s the time on the pi correct? This is synced to the spark on connect.
The spark also gets the time through sntp if it had an Internet connection, but not when it only has USB.
And is the profile enabled? I just noticed the grey dot on that block.
Date/time is correct on the pi.
Spark 3 only has USB connection to the pi.
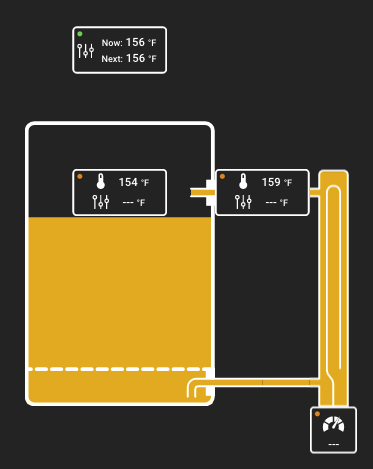
Profile was disabled on that screen shot, which corresponds to the first of the two other pics.
I enabled the profile to get the second of the other two screen shots.
If the profile is set to start some time in the future, none of the settings are prescribed and all the blocks show no settings “—”
(BTW, that used to not be the case. A year or so ago, the settings would hold their current value until the first profile point came to be. Not a big deal, but I like that behavior better than the no setting behavior.)
So, it seems as if the blocks are “47minutes and some change” behind the system clock on my browsing computer.
I double checked that the pi has the correct time and it does.
I rebooted the pi to see if the connect would jam sync the spark but no change there.
We wanted to standardize to have predictable behavior after reboots, and decided that “on when it shouldn’t be” is generally worse than “not on when it should be”.
We’re working on a fix for this on our end. Meanwhile, does the problem resolve when you power cycle the Spark (not reboot it from the web UI)?