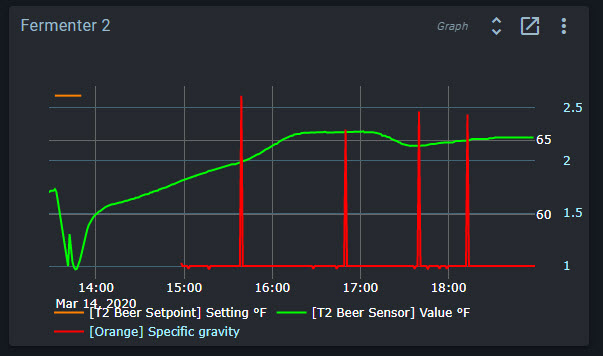
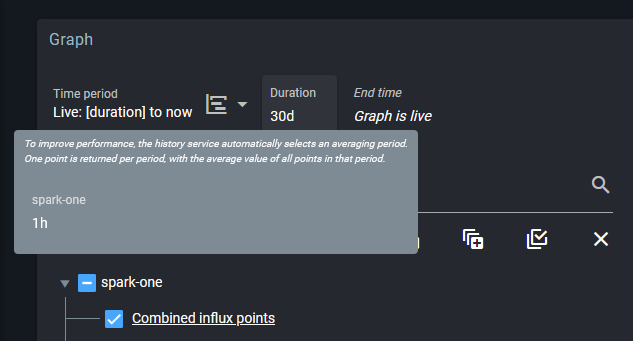
So looks like its not being interpreted correctly.
Output of docker-compose config.
I’ll add it to the other file. and let you know.
datastore:
image: treehouses/couchdb:2.3.1
labels:
traefik.frontend.rule: 'PathPrefixStrip: /datastore'
traefik.port: '5984'
restart: unless-stopped
volumes:
- /home/pi/brewblox/couchdb:/opt/couchdb/data:rw
emitter:
image: brewblox/brewblox-emitter:rpi-edge
labels:
traefik.frontend.rule: 'PathPrefix: /emitter'
traefik.port: '5000'
restart: unless-stopped
eventbus:
image: arm32v6/rabbitmq:alpine
restart: unless-stopped
history:
image: brewblox/brewblox-history:rpi-edge
labels:
traefik.frontend.rule: 'PathPrefix: /history'
traefik.port: '5000'
restart: unless-stopped
influx:
environment:
INFLUXDB_DATA_INDEX_VERSION: tsi1
INFLUXDB_DATA_WAL_FSYNC_DELAY: 1s
INFLUXDB_HTTP_LOG_ENABLED: "false"
INFLUXDB_LOGGING_LEVEL: warn
image: influxdb
restart: unless-stopped
volumes:
- /home/pi/brewblox/influxdb:/var/lib/influxdb:rw
mdns:
command: --port=5000
image: brewblox/brewblox-mdns:rpi-edge
network_mode: host
restart: unless-stopped
spark-one:
command: '--name=spark-one --mdns-port=5000
'
depends_on:
- datastore
- eventbus
image: brewblox/brewblox-devcon-spark:rpi-edge
labels:
traefik.frontend.rule: 'PathPrefix: /spark-one'
traefik.port: '5000'
privileged: true
restart: unless-stopped
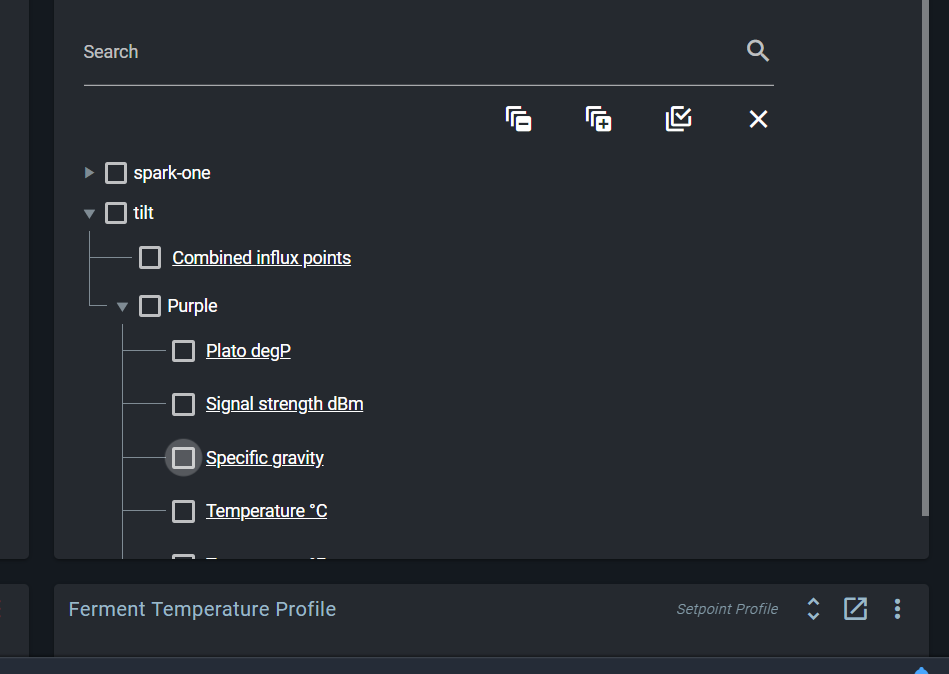
tilt:
command: -p 5001 --eventbus-host=172.17.0.1
depends_on:
- history
image: j616s/brewblox-tilt:rpi-latest
network_mode: host
privileged: true
restart: unless-stopped
volumes:
- /home/pi/brewblox/tilt:/share:rw
traefik:
command: '-c /dev/null --docker --docker.domain=brewblox.local --entrypoints=''name:http
Address::80 Redirect.EntryPoint:https'' --entrypoints=''name:https Address::443
TLS:config/brewblox.crt,config/brewblox.key'' --defaultentrypoints="http,https"
'
image: traefik:v1.7
ports:
- 80:80/tcp
- 443:443/tcp
restart: unless-stopped
volumes:
- /home/pi/brewblox/traefik:/config:rw
- /var/run/docker.sock:/var/run/docker.sock:rw
ui:
image: brewblox/brewblox-ui:rpi-edge
labels:
traefik.frontend.rule: Path:/, /ui, /ui/{sub:(.*)?}
traefik.port: '80'
restart: unless-stopped
version: '3.0'