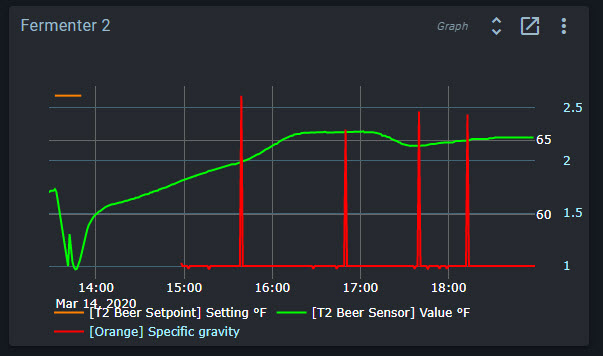
I got my system upgraded to BrewBlox finally. I installed the Tilt service but am seeing periodic spikes that will make the data unreadable. The tilt is sitting in a pitcher of water and really shouldn’t be seeing any change. I have two Tilts and both are doing this but not at the same times. Any suggestions?
We’ve seen the issue before, but there it reported a single spike with 9+ zeroes.
The problem should eventually be fixed in the Tilt service itself, but for now the best solution is to manually remove the offending data points from the history database.
I’ll have to get back to you for the exact sql command to do so: that is not something I can write on my phone and get it right the first time.
Thanks, I found the post on this. Didn’t realize Influx was behind this. Given that I work with commercially available time-series historians on a daily basis this was a good learning experience. I ended up writing a script that removes points < 0.995 and > 2 for now and scheduled it to run every 10 mintues.
The service really needs to be doing some filtering and probably averaging of the points. Even better would be generic settings to do filtering an averaging on the raw historian data in the plots.
Just to avoid any doubt, this plugin isn’t part of the main code base. It’s something I’ve created in my spare time, hence it’s functionality being minimal. Pull requests are welcome.
Maybe if the corona thing last long enough I’ll try learning some Python.
Generic filtering and averaging I would envision being an option in the chart. Keep the raw data in the historian but filter when querying Influx for the plot.
The data stored in the history database is too dynamic to allow for effective history-side filtering. All services can push arbitrary data.
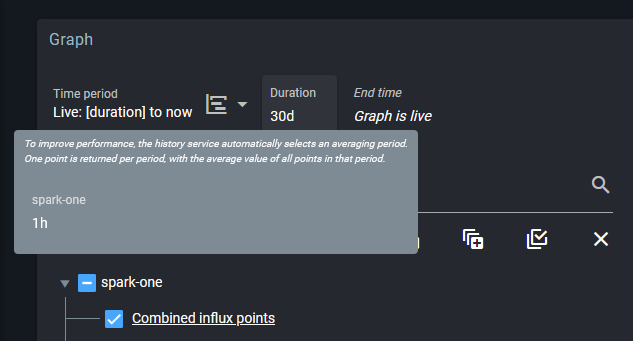
We do automatically average data, in steps of 1m, 10m, 1h, and 6h. Realtime data is kept for 24h, and the averaged datasets are kept indefinitely.
Downsampled datasets are stored as retention policies of the brewblox database. For example: to show available fields for the spark-one service, averaged with a 10m period, you can run show field keys on "brewblox"."downsample_10m"."spark-one".
Whenever the UI fetches data for a graph, the most suitable dataset is selected. You can see which dataset is used by hovering over the selector in graph settings.
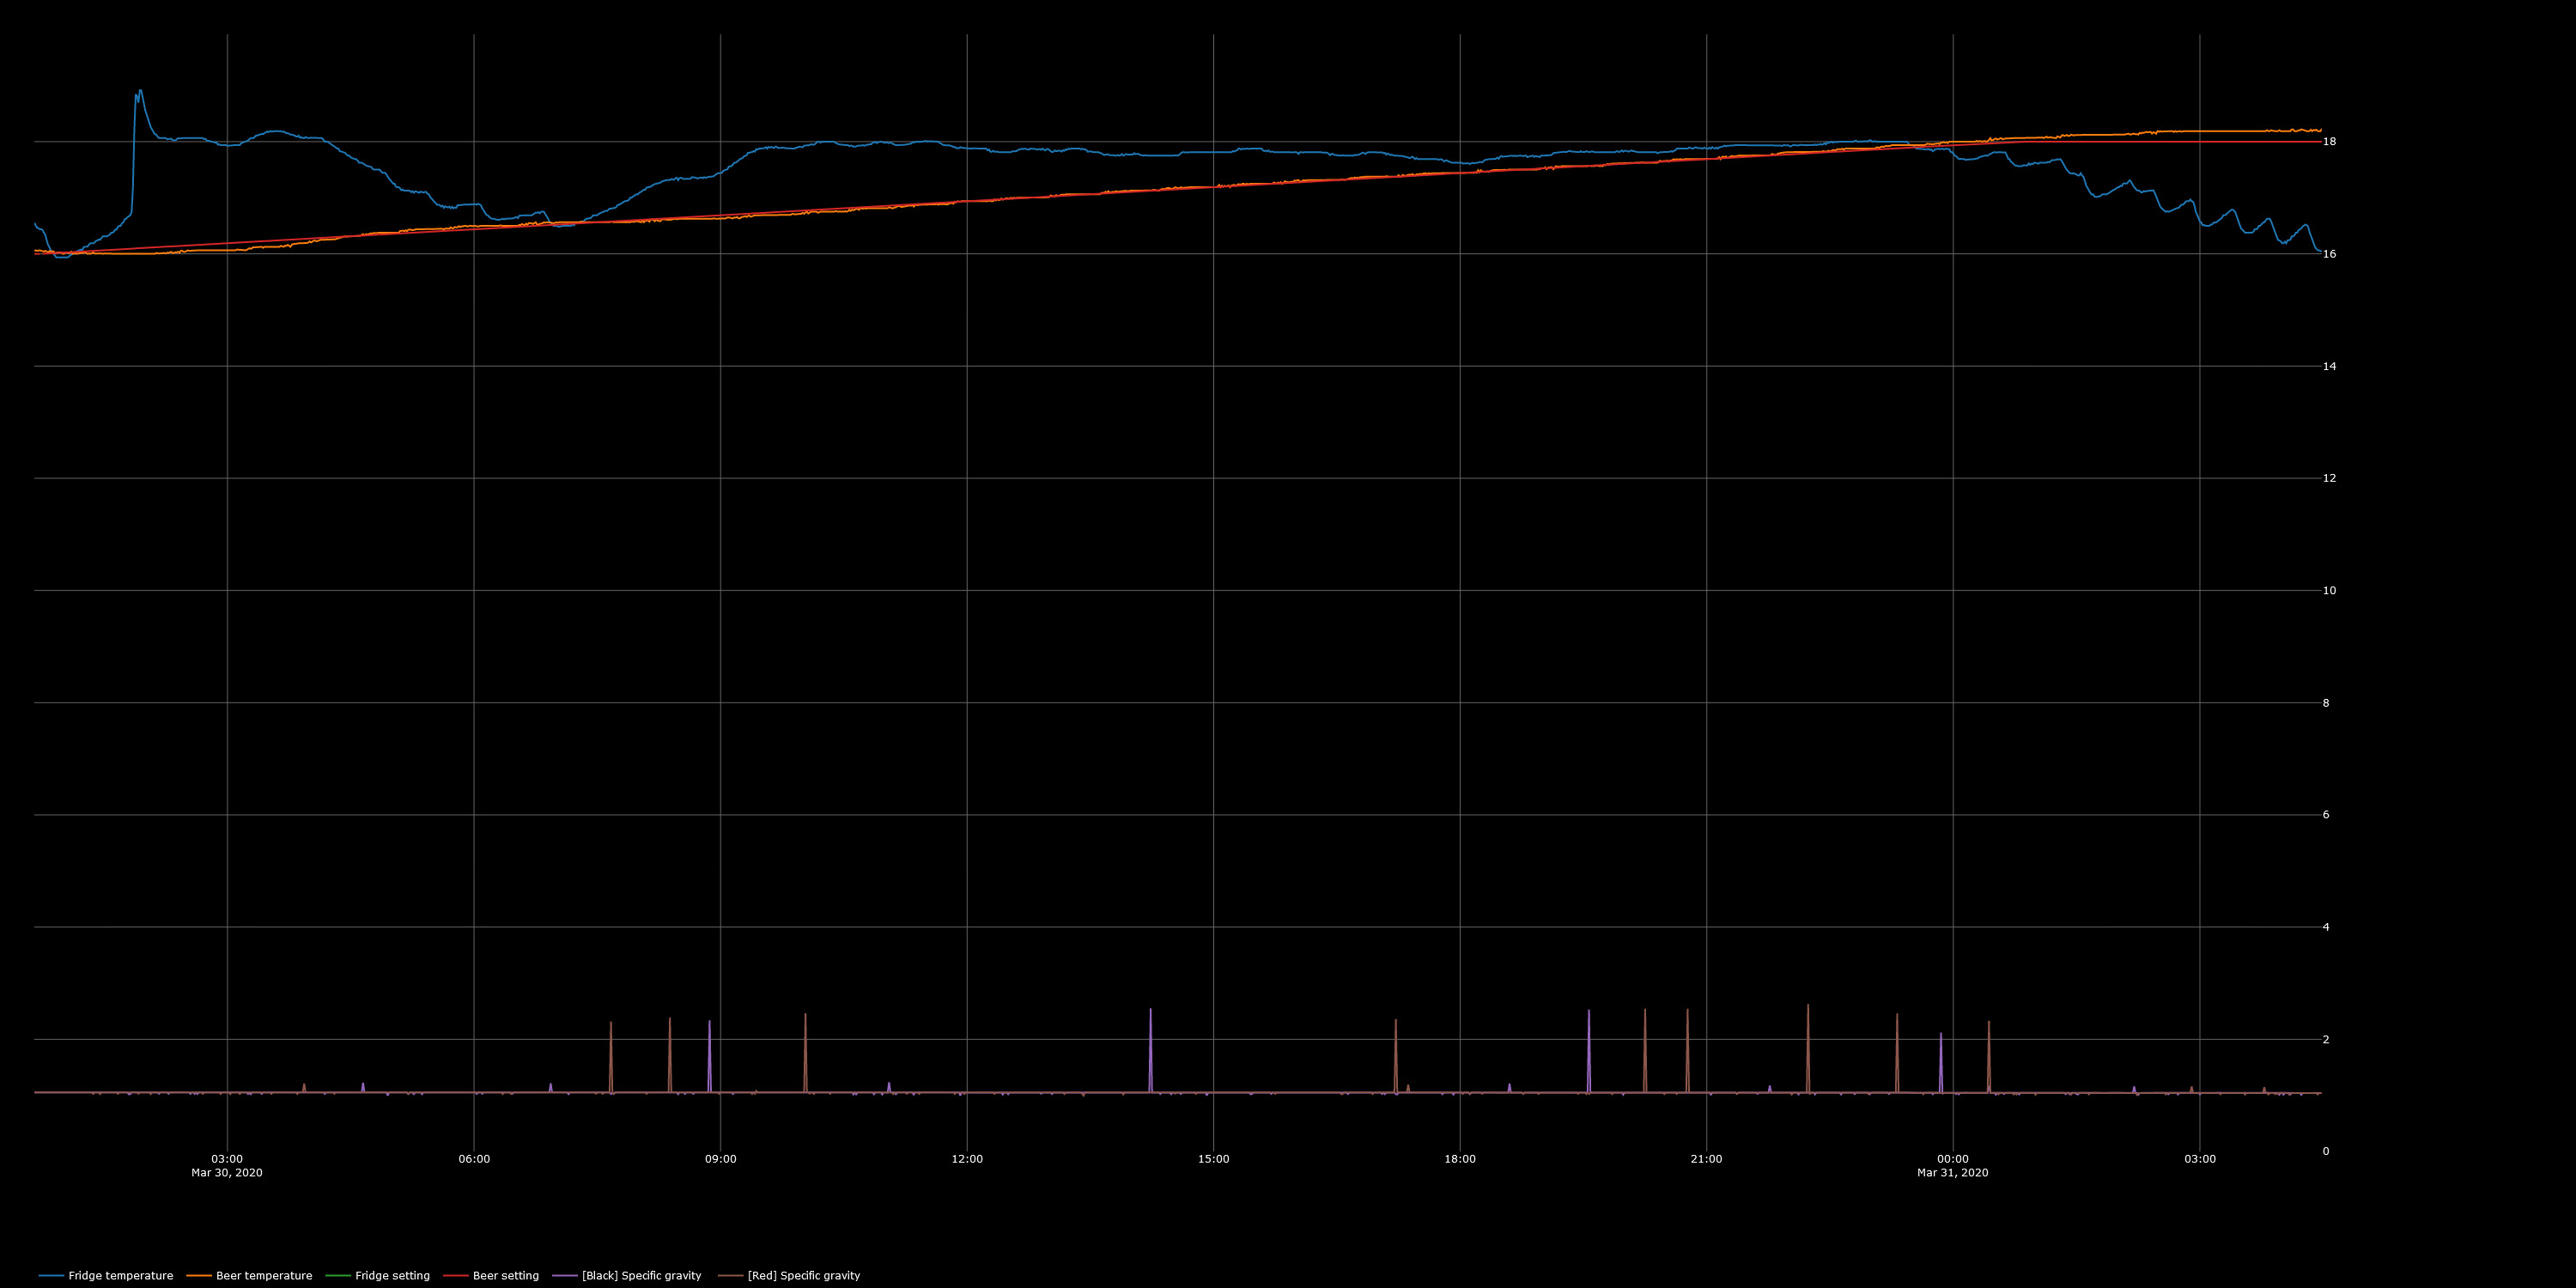
I found numerous points in the downsampled db’s that had high values due to the averaging so that makes sense. I can’t find this, but are there any options to set fixed limits on the Y axis?
The real fix would indeed be to never push invalid values to the database by doing a sanity check in the tilt service. A simple skip if SG value is not between 0.5 and 2 should suffice I guess?
There is an issue open for adding manual overrides for graph ranges in the UI. It’s a feature that would need careful UX design for it to not create more confusion than it solves issues.
As a direct fix, I’ll submit a fix to the Tilt service. It’s significantly simpler to fix the problem there.
I’m losing connection after a couple days too so I’ve kind of given up on this for now. I’ve never had that problem with my TiltPi and the two RPI’s are only about 12" apart. Not a huge deal since I’ve been displaying the TiltPi interface on a Fire 7 for the last year.
First fermentation on the new system is well underway. Used a recipe called “Crowd Pleaser IPA” but I should probably put it on my taplist as something else given the current situation.
I updated my brewblox setup today, and after i updated, the tilt stoped reporting in. looked in this thread and saw that I needed to add the above to the compose file, so I added this to the docker-compose.yml file. Restarted brewblox and it isn’t updating.
By isn’t updating, I meant that the Tilt dashboard I had had not displayed any data. There was data from prior to updating Brewblox to the current build. Then when I added the events entry to the docker-compose file, it still didn’t update and display more data. I left it overnight, and now this morning it is showing current data. I updated at ~3pm, realized around 6pm that Tilt wasn’t working, and updated the events at that point, by 11pm the graph was still not showing current data. 8am today, data is now closer. It started to report data overnight but has since stopped. If it is sporadically working, it may now be an issue with reception of the signal.
Your logs aren’t showing issues in brewblox itself. Your spark is using USB, so that doesn’t rule out wifi trouble.
The Tilt isn’t reporting relevant connection errors, but it does report a discovery long after startup.
2020/03/29 01:25:32 INFO     Creating [tilt] application
2020/03/29 01:25:32 INFO     Started TiltScanner
2020/03/29 01:25:44 INFO     Found Tilt: Green
2020/03/29 04:51:14 INFO     Found Tilt: Purple
I’m not the expert on Tilt matters, but it does look like a bluetooth issue.
Maybe I missed something in the set up or configuration, how did you get the Tilt’s SG graph to have its own scale. Mine is unreadable as it uses the same scale as for the temperature - so just looks like a flat line near the bottom.
@j616s James, thanks for the work on the tilt integration over the years!
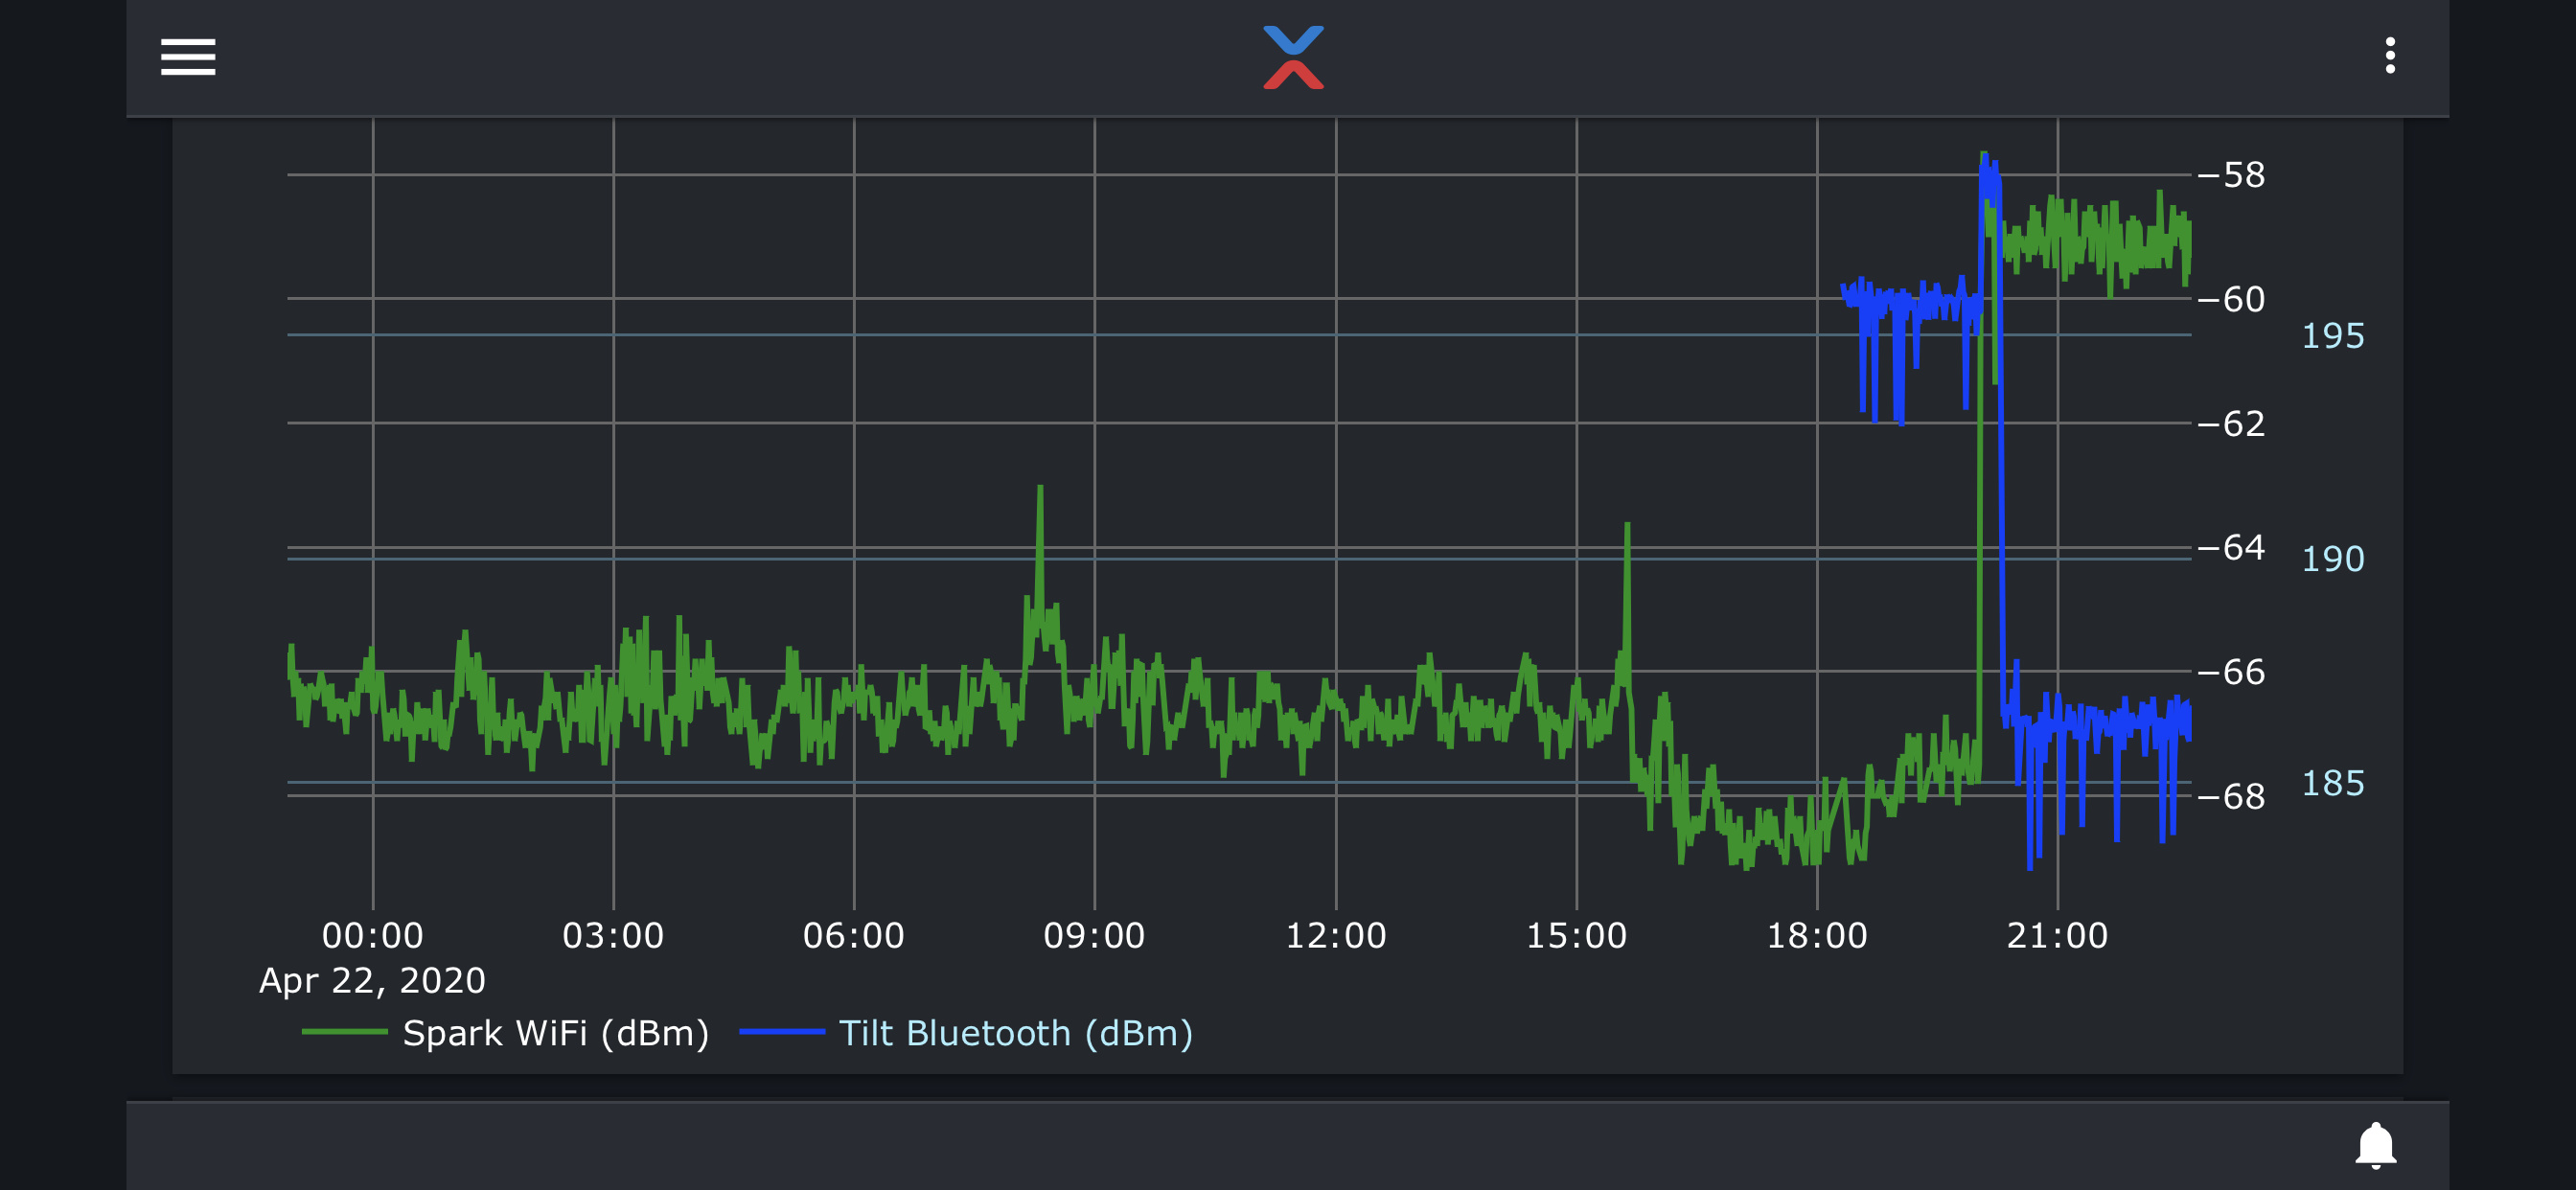
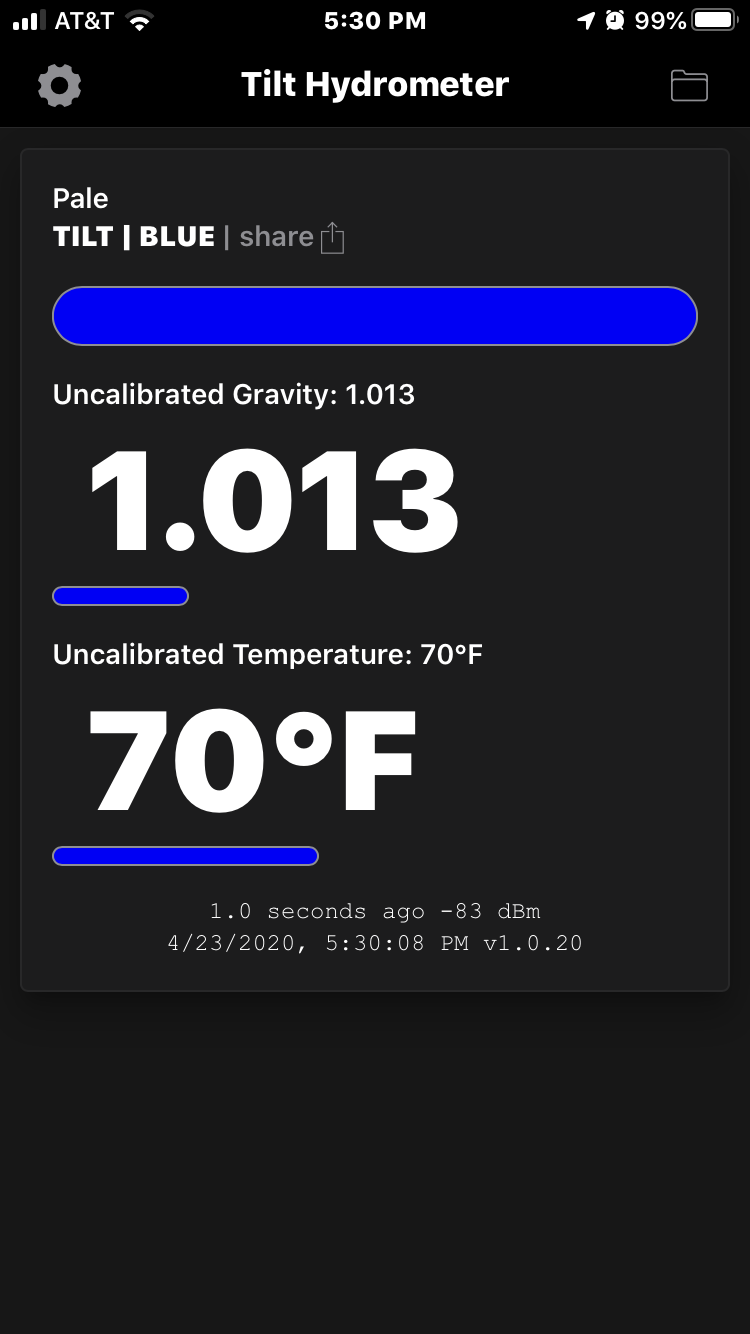
I recently started a graph in brewblox that includes the brewpi spark WiFi signal strength and the Tilt Bluetooth signal strength. Both are stated to have units of dBm.
Why is the Tilt signal strength being reported as a positive number? Mine usually ranges between 180 (worse) to 200 (better) “dBm” as I reposition the rpi running brewblox in relation to my fermenter. The Spark Wifi reports with negative numbers as expected, and goes further negative as reception gets worse. The Tilt bluetooth signal strength value seems inverted.
Am I misunderstanding something, or is the Tilt signal strength data really inverted as I suspect?
That’s definitely a problem on my end. Slightly embarrassing but I might not actually have tested it. Just seen I could grab a number and put it somewhere. I’ll stick an issue in to figure out how to correctly convert the number I get from the bluetooth libraries. Thanks for spotting.