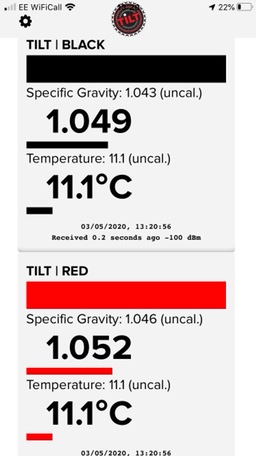
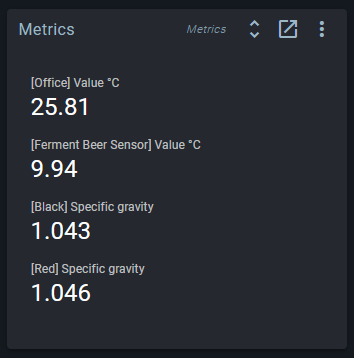
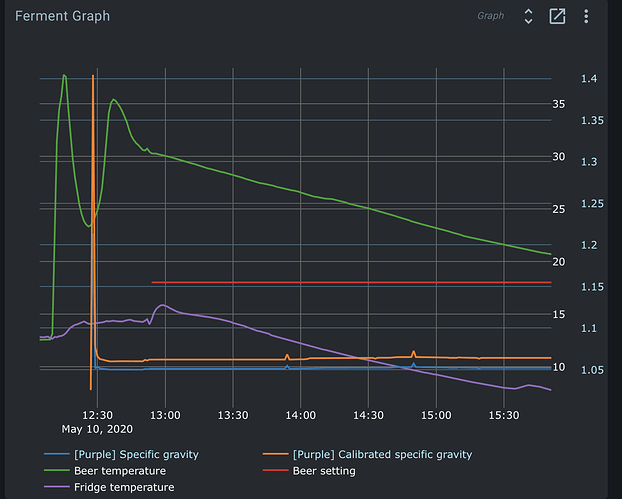
Seeing odd behaviour. Both if my Tilts are in the same beer,. The Tilt service appears to not be using the calibration file. Both in the graph, and in a metrics tile I have on the dashboard, the values shown are the uncalibrated values, not the calibrated ones.
I have added the same calibration points into both the Tilt app, and the SGCal.csv. It does appear that it is found on load, but not sure why it is not being used.
pi@fridgepi:~/brewblox $ brewblox-ctl follow tilt
Attaching to brewblox_tilt_1
tilt_1 | 2020/05/03 03:05:12 INFO brewblox_service.service Creating [tilt] application
tilt_1 | 2020/05/03 03:05:12 INFO brewblox_tilt Calibration file /share/SGCal.csv loaded for colours: Black, Red
tilt_1 | 2020/05/03 03:05:12 WARNING brewblox_tilt Calibration file not found: /share/tempCal.csv . Calibrated values won’t be provided.
tilt_1 | 2020/05/03 03:05:12 INFO brewblox_service.service Service info: v1.0.2-47-gfe397ed @ Sun Mar 29 17:36:24 UTC 2020
tilt_1 | 2020/05/03 03:05:12 INFO brewblox_tilt Started TiltScanner
tilt_1 | 2020/05/03 03:05:13 INFO brewblox_tilt Found Tilt: Black
tilt_1 | 2020/05/03 03:05:13 ERROR brewblox_tilt Error when publishing data AmqpClosedConnection()
tilt_1 | 2020/05/03 03:05:13 INFO brewblox_tilt Found Tilt: Red
tilt_1 | 2020/05/03 03:05:13 ERROR brewblox_tilt Error when publishing data AmqpClosedConnection()
[…]
pi@fridgepi:~/brewblox $ cat tilt/SGCal.csv
black, 1.002, 1.000
black, 1.089, 1.095
black, 1.073, 1.077
black, 1.063, 1.066
black, 1.047, 1.053
black, 1.036, 1.043
black, 1.029, 1.034
red, 0.997, 1.000
red, 1.098, 1.095
red, 1.071, 1.077
red, 1.059, 1.066
red, 1.047, 1.053
red, 1.037, 1.042
red, 1.027, 1.034


Any ideas?
Thanks,
Jerry
