Replace all blank lines in TEMPERATURE.* and GRAVITY.* with # comments as the first character.
The code doesn’t tolerate any blank lines in those files.
e.g. #Gravity Calibration file for Tilt Hydrometer #To be active, the file should be named GRAVITY. in the tiltHydrometer/ folder #and have at least one calibration value inside. #File must not have any blank lines. #To calibrate a black tilt hydrometer, the file would be called GRAVITY.black #The following example two calibration points are used. #0.997 read from the tilt hydrometer will be calibrated to the actual value of 0.999 #1.056 read from the tilt hydrometer will be calibrated to the actual value of 1.060 #Other calibration points will be calculated.
# #Original SG Value, Calibrated Value
1.011, 1.000 #EOF
Well I don’t know if finally getting the calibration pages edited and working correctly did it, or the modification JVgolf mentioned in brewometer.py was the fix or a combination. But finally the temp logging is correctly reading in F. I have both tilts within a couple of points of each other. Seems I may finally have this working correctly.
Now lets see if I can get the battery monitoring going without breaking anything.
Apologies, have been away for a week at the beach. Thought I would have more time to reply, but it didn’t work out that way.
I’ve updated the code in the repository to be more resilient when parsing the config files. It will not handle blank lines and print out a warning for any lines that are not parsed (comments/blank/invalid). However, if that’s still not working, I’ve added a Debug switch in settings.ini to turn on more logging.
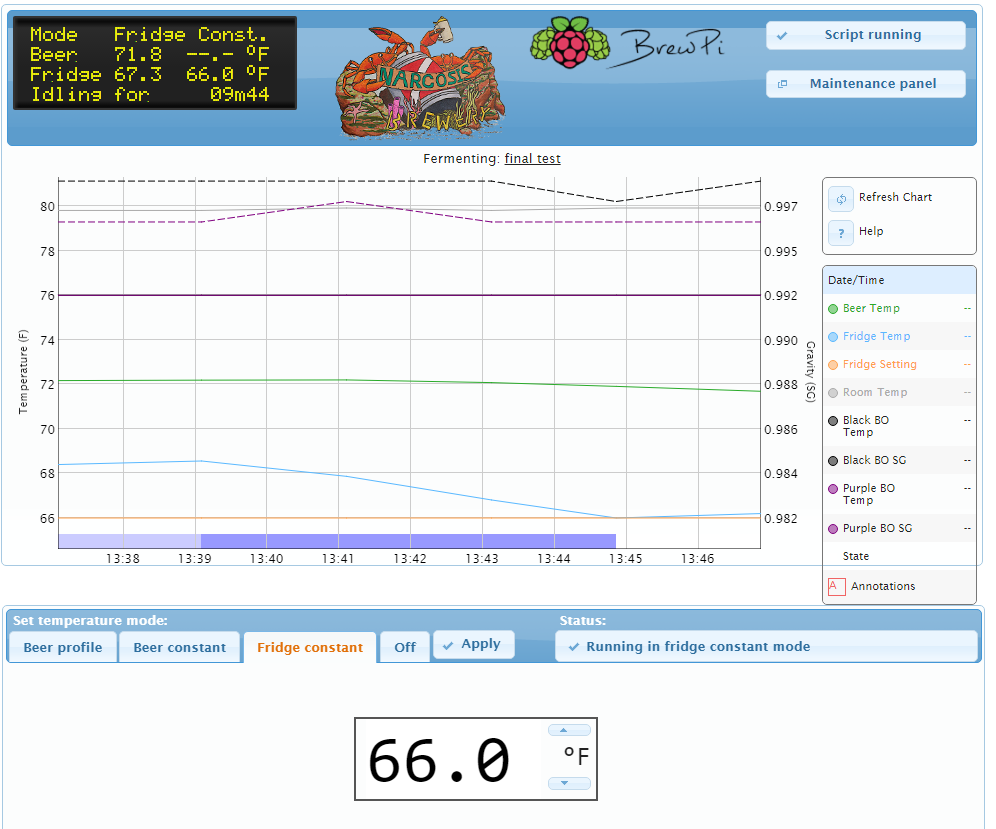
@andylytical Hmm. Have you run the TiltHydrometerTest.py file and confirmed that the script can see your tilt? Looking at the graph above, it appears that the script still isn’t installed correctly… As @frizzo points out, you shouldn’t see all the other colours (or any colours if a tilt can’t be detected).
@Ron_K, glad you got it working. For future reference, the Fahrenheit conversion can be configured through the tiltHydrometer/settings.ini file (in /home/brewpi). Change the line FahrenheitTemperatures: False to FahrenheitTemperatures: True if you want temps in F.
RPi2 with Photon Spark, I have updated the RPi, Spark and Brew-Pi using the respective update/upgrade commands.
Strangely enough, I was away for a few days and on my return was surprised, but very pleased, see that my display is now correct. However, it now takes forever to reload, so I am going to try moving from 10 second data pints to 30 seconds
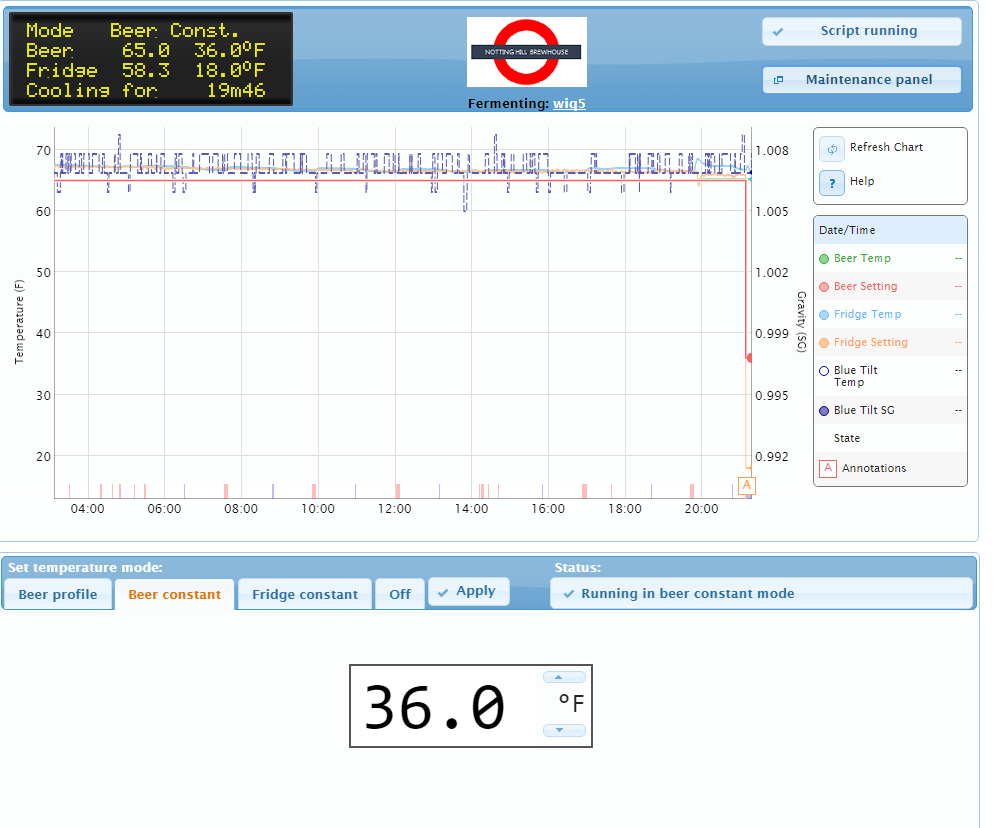
@sbowler Look below, it seems to be working. I left it alone for a few days (went up to Washington DC for this little event they had there a few days ago) and when I came back look what I found: (zoomed view)
As mentioned in another post, this view has a very slow response, so I am trying switching the frequency of data points. I said 30 seconds in the other post but decided to try 1 minute.
Thanks for the comments @sbowler and @frizzo. Thanks for posting your hardware and versions @frizzo and @NottingHill. So far, after two responses, I’m the only one on an RPi3. Anyone else have this working on an RPi3? I know it seems illogical that the RPi hardware version matter, but from a software view, I haven’t found anything missing in my setup.
I have made numerous updates to my installer scripts (https://github.com/andylytical/brewpi-scripts), of most significance is a ‘diff’ check of all files expected to be copied and a json parser to show that the tilt data is getting collected and logged properly. Both of these checks pass.
But I still have the exact same graph as before, where beer_panel shows all possible tilt colors, redTemp is graphed in green, and redSG is graphed in red. While it is certainly possible I have made a mistake somewhere, I have yet to find it (or them). Maybe I’m looking in the wrong place. Any other thoughts? Really, anything! Maybe it’s something so stupid I’ve overlooked it or made an invalid assumption (aside from, is the power turned on, I’ve got that one covered).
Or maybe I’ll try out @NottingHill’s strategy of taking a few days off.
Hi @andylytical,
I use the Tilt on a RPi3 …
I have a photon with 0.4.4.4 running on Jessie with a version 1 Tilt (no LED’s)
The latest Tilt mods were done from the repository which was current on 29/12/2016.(but I have had various versions of the code in place for a while)
It’s a bit old school but I tend to stop logging etc after I have download the Zip to the mac, then unpack it and use forklift( ftp client) to move files into place, ssh into the Pi and fix ownership . and run the test script to make sure the tilt is seen then reboot .
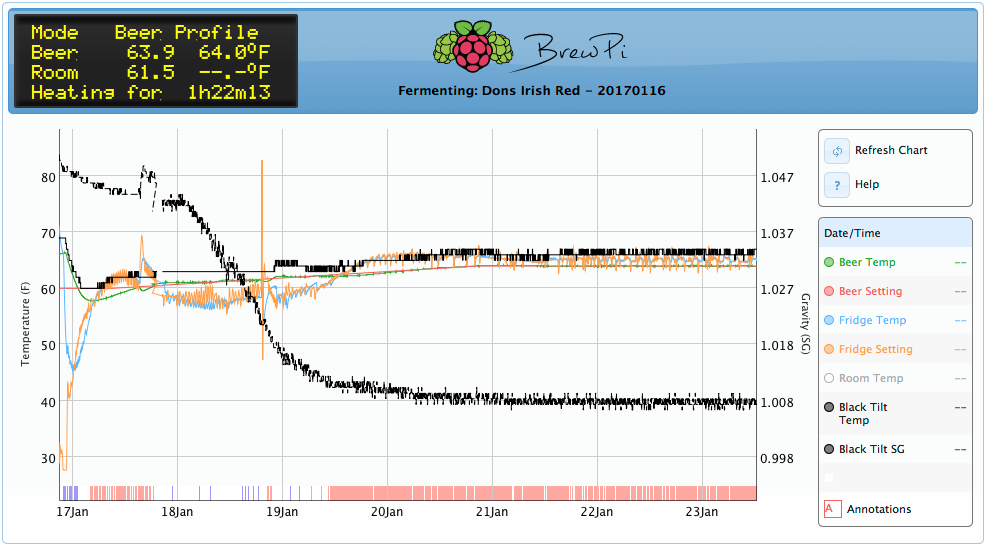
I have in the past noticed a delayed start where I couldn’t get it logging immediately but by the time I had got to the house from the shed it had started, here is my current brew, started friday…
Greeting,
I have an RPI3 and Arduino up and well running with Brewpi legacy installation. Now I have my TiltHydrometer (Brewometer) in my hand, and have read 189 post about it.
Little confused about all the reading, so I ask before starting, is there anyone who can give me a short hint on if this will work with latest repository from @sbowler, AND/OR, give me a hint where to start look for the installation for the legacy BrewPi with TiltHydrometer intergration.
I have the same equipment as you. I recommend you clone this repository. https://github.com/supercow/brewpi-brewometer he forked off of sbowlers using the legacy version of brewpi for us Arduino users.
@andylytical,
If I get time soon, I’ll pull a copy of your scripts, etc… and run some diffs myself.
Did notice, as others have, that the Tilt data takes a while to show up… Tilt temp matched my thermapen, so looks like my brewpi beer temp sensor is about 1.8 deg. low… will need to run a calibration on beer/fridge/room sensors after this brew is done.
Also, is it me, or have the graphs gotten a LOT slower (minutes to load) after a week+ of data points with 0.4.4?
I did the exact thing in the readme from https://github.com/supercow/brewpi-brewometer, copy and replace file for file, but it seems to be any failure in the script. The Brewometer-test find my Brewometer, so it reads from it.
In my Brewpi, the script will not start, in the log I got this reported now.
Jan 23 2017 23:16:04 Opening serial port Jan 23 2017 23:16:04 Notification: Script started for beer 'None’ Jan 23 2017 23:16:14 Checking software version on controller… Jan 23 2017 23:16:14 Found BrewPi v0.2.10 build unknown, running on an Arduino Uno with a revC shield on port /dev/ttyACM0
ERROR: the newest version of BrewPi is not compatible with Arduino. You can use our legacy branch with your Arduino, in which we only include the backwards compatible changes. To change to the legacy branch, run: sudo ~/brewpi-tools/updater.py --ask , and choose the legacy branch.
Yes
You need to install the legacy branch of brewpi. The current version for the spark does not work with the Arduino builds.
Follow the instruction to run updater. Py --ask. When prompted choose legacy.
If the other colours aren’t dissappearing, then this indicates that the modifications to the js/beer-chart.js file potentially haven’t been made (or the browser is using a cached version).
Can you check that you’ve updated this file to be the same as the one from git?
Unfortunately the Brewpi extension to the data structure for the current version of BrewPi means that it gets significantly slower after a few days of logging. Slowing down the logging frequency can help with this.
I believe than when @Elco releases the newer version, this should allow more efficient rendering of the graph even with additional data points.
yea… thanks for taking the time to be helpful with your response about this.
been on this merry-go-round for a while now. just whining while waiting for my beer.
Hi @sbowler, My installer script checks all copied files with a diff
pi@brewpi:~ $ sudo brewpi-scripts/tilt_install.sh -v
... ... (skip a few lines)
Get brewometer code... Cloning into '/tmp/tilt-install/brewpi-brewometer'...
... ...
Installing tilt web files... sending incremental file list
... ...
Files /tmp/tilt-install/brewpi-brewometer/brewpi-web/js/beer-chart.js and /var/www/html/js/beer-chart.js are identical
and checking by hand:
pi@brewpi:~ $ ls -l /tmp/tilt-install/brewpi-brewometer/brewpi-web/js/beer-chart.js /var/www/html/js/beer-chart.js
-rwxr-xr-x 1 www-data www-data 26035 Jan 24 08:52 /tmp/tilt-install/brewpi-brewometer/brewpi-web/js/beer-chart.js
-rw-rwxr-- 1 www-data www-data 26035 Jan 24 08:52 /var/www/html/js/beer-chart.js
I even had the idea last night that maybe it wasn’t working because I hadn’t reattached the “beerTemp” temp probe, but alas, one reboot and two new brew logs later, still no luck.