Yup! thank you that worked for the calibration. Now just to fix the scale on logging and displaying
Is the gravity scale not adjusting as you zoom? If so, I think that’s a bug. I’ve seen it on my phone but it works fine on my laptop.
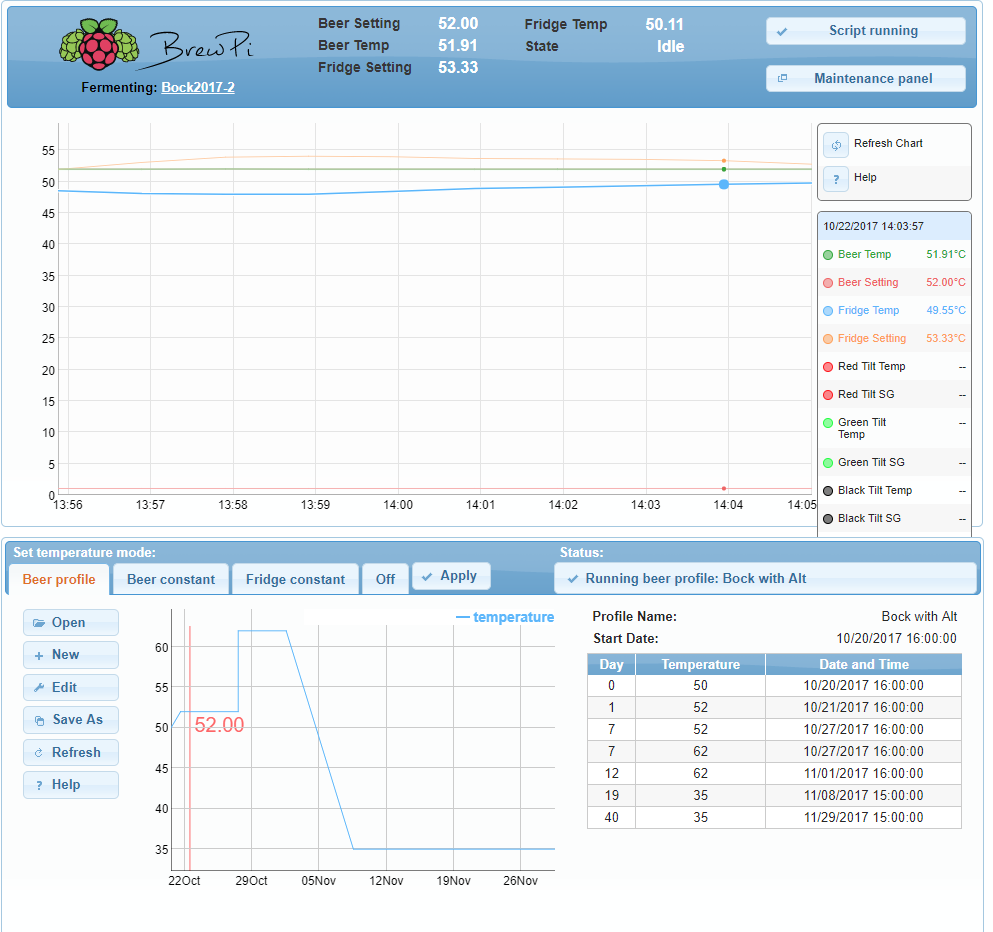
I did a little more file moving around to make sure that all the files were where they needed to be so now it looks like this. The red line at the way at the bottom is the gravity reading. No data is shown on the right side next to “Red Tilt SG” and turning it on and off do not get rid of the red line in the chart.
Hi @zakit24 ,
I’m not sure the modification files have been applied properly above. It looks like the js/beer-graph.js isn’t updated with the modifications, which is why you’re seeing all the extra colours.
That’s what I thought too, but i specifically went in a copied the brew-chart.js file over and then went in nano to make sure it was the Tilt version and it is.
Maybe try a Ctrl-F5 refresh in the browser? This will force a refresh of the browser cache in case that is the problem.
sigh  can’t believe that was the issue. I was doing that earlier in my trouble shooting, but didn’t for a while so sadly I now don’t know at which step it was actually working. Sometimes you just need to do the good old refresh. THANK YOU!
1 Like
Hi all, long time lurker, first time Tilt’er. Thanks to @sbowler and @jlvnyc (on github) for all of this. A truly welcome service to the community all this is, so thank you. 
That being said, I’m having a little trouble with the temperature settings and maybe someone could point me in the right direction. I’m running legacy brewpi (latest available from github), with the https://github.com/jlvnyc/brewpi-brewometer installed, which appears to work fine on the legacy (Arduino Rev C and RPi3) branch, but I’m having trouble with the temperature readout onto the brewpi graph. It seems to be stuck on 19.44 deg F when the OneWire temperature probe is reading 67.0 deg F in the same solution, even though FahrenheitTemperatures: True is set. I’ve tried various values in the TEMPERATURE.orange configuration ini, but honestly, I’m not sure what to put in there because it appears not to change the output. Did I miss something when I was setting it up? Thanks!
Hi @neoresin. When you set the FahrenheitTemperatures: True, did you restart the script? This setting is only read when the Brewpi.py script is starting.
Hi @sbowler! (Thanks for all the contributions you’ve given! And thanks for replying!) I did indeed restart the script, found that it was still showing the deg C temperature, stopped the test brew I had going, stopped the script, then proceeded to remove everything within /var/www/html/data/ except the profiles directory (not sure if that residual values might have been leftover somehow as a baseline for future brews), restarted the script, then started a new brew, but that all didn’t work. I haven’t located where the values for temperature for the Tilt might be stored - maybe you or someone could provide some insight into that? Or I’ll go poking around in the code… Haven’t had to go that far yet though. Anyway, thanks for being available to chat about it.
Hi again @sbowler , it would be in the /home/brewpi/brewometer/ directory. I’m also on the #brewpi IRC as Megaman if you want to chat there.
Howdy - I believe I’ve figured out what’s going on.
The fork you’re working on was taken before settings.ini was added. So to make the script read in Farenheit, you need to change some code.
Go to the brewpy.py file and find the line (line 427):
brewometer = Brewometer.BrewometerManager(False, 300, 10000)
change it to:
brewometer = Brewometer.BrewometerManager(True, 300, 10000)
That should fix your problem.
@sbowler - well caught! Unfortunately, if I enable that, then stop then start the script, it causes the lines to disappear from the graph and the legend. If I set it to False again on line 427, the lines reappear. I assume that’s set that way for a reason, and it’s got repercussions down the line. Not sure where this goes from here.
I’m still new to python, but stderr.txt seems to have this occuring:
Unhandled exception in thread started by <bound method BrewometerManager.scan of <Brewometer.BrewometerManager instance at 0x74cdacb0>>
Traceback (most recent call last):
File “/home/brewpi/Brewometer.py”, line 324, in scan
self.storeValue(name, temperature, gravity)
File “/home/brewpi/Brewometer.py”, line 280, in storeValue
brewometer.setValues(temperature, gravity)
File “/home/brewpi/Brewometer.py”, line 147, in setValues
self.values.append(BrewometerValue(calibratedTemperature, calibratedGravity))
File “/home/brewpi/Brewometer.py”, line 112, in init
self.temperature = round(temperature, 2)
TypeError: a float is required
Hi @andylytical can you give a quick walkthrough of replacing the old dygraphs with the new? Is it a fairly straightforward process?
I did not replace the dygraphs version in the brewpi, only used the latest in the backup area. You’re idea sounds reasonable though. I suggest if you try it out, post your results in a new thread (not really tilt related and this thread is already very long).
Cheers!
Hi @neoresin,
I posted an update to the beer-graph.js file which fixes some/most/all of the slowdowns. It doesn’t update the version of dygraphs, but the slowdowns were because of the way the script processes the data before display.
Hmm. The stack trace is a bit more puzzling…
Can you try changing line 267 from:
return (int(temperatureF) - 32) * 5.0 / 9
to
return (float(temperatureF) - 32) * 5.0 / 9.0
and see if that makes a difference?
Thank you everyone for all your hard work here. I just received my Tilt hydrometer and have been able to connect everything and get logging. I wonder if anyone has been able to utilize the Tilt’s temperature reading instead of the one-wire temp probe to monitor beer temperature?
Also, is it even conceivably possible to use the Tilt’s SG readings to trigger temperature changes? I would love to be able to create a profile that would automatically adjust temperature at a specified SG number.
Hi @Hemmieweizen, It’s possible to use the Tilt for logging temperature, but not for BrewPi temperature control purposes. The Spark/Arduino is responsible for taking the temperature readings and then controlling the fridge temperatures. At the moment, the Tilt integration is between Tilt and the Raspberry Pi (not involving the Spark/Arduino controller), so it’s just for logging purposes. I’d also say that the OneWire temperature probes are a lot more accurate/sensitive than the Tilt.
It’s conceivably possible to use the Tilt’s SG readings to trigger a temperature control change. I haven’t implemented this yet as was waiting for @Elco’s framework update.