[solved, see bottom] I think I’m having the same issue as @Richard_Crump has had and shown; could I ask for advice?
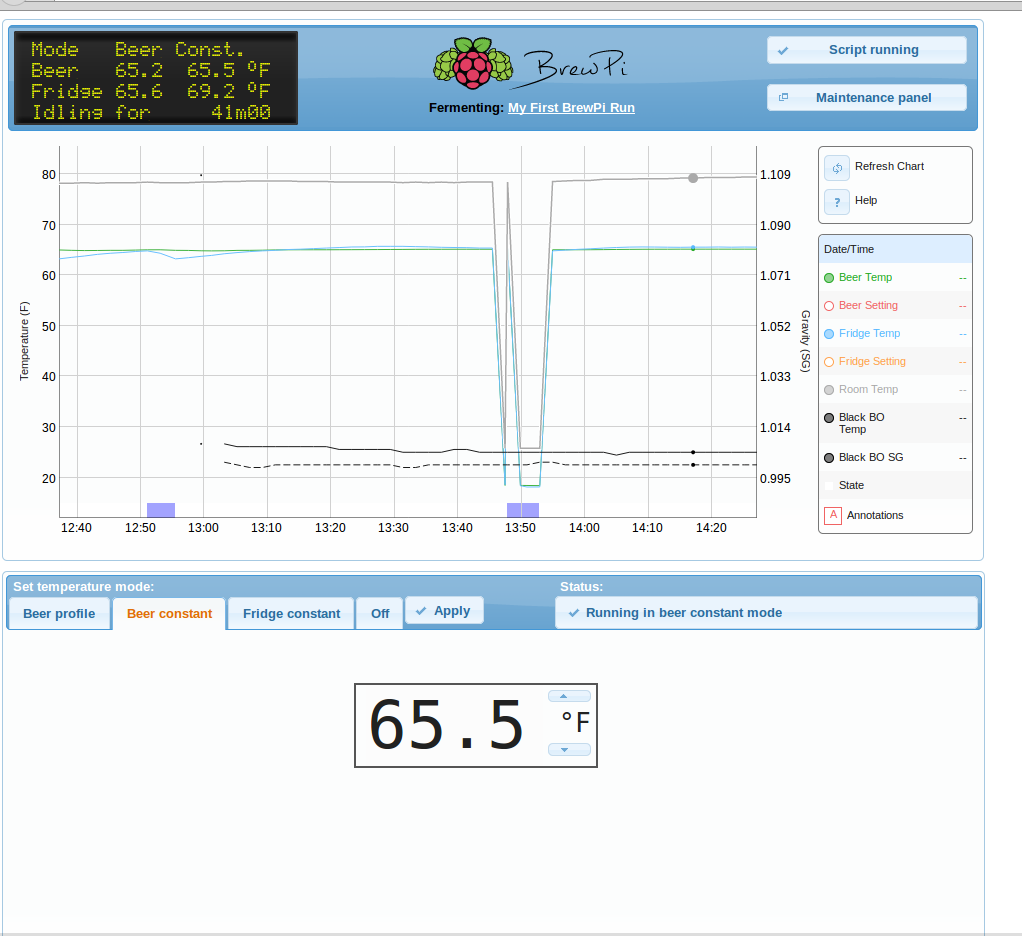
I’m running raspberry pi 3 with the brewpi spark, and all of the files are in place (from @sbowler 's brewpi-brewometer github), the BrewometerTest.py is receiving data from my purple brewometer, the data is logged in the csv file, and I’m not sure it appears on the page as there are multiple instances of a brewometer present, which do not disappear after a while, and there is no right axis (SG) label.
I have installed the brewpi-brewometer by git cloning all files to /home/pi/installfilesbrewometer and then rsync’ed (-av) all files to the folders of installation. Could this be a reason why the above happens? I believe rsync wil automatically overwrite the files.
I’ve tried changing the ownership of all files in /var/www/html to brewpi, but then the button ‘start/stop script’ does not work anymore in the web interface, and changing it back to www-data solved that. Should I chown all files within /html to brewpi, or only certain files?
I’ve taken beer-chart.js from a backup but this also did not help. Which version of beer-chart.js should I use? I believe the one from the brewometer-brewpi, as it is said above it will remove the brewometer-types that do not get any data; I now run the version from sbowler (I have checked this with sudo diff).
Thank you for your response!
EDIT: I’ve switched off the raspberry for a couple of days and planned to use it as is (it was logging everything in a CSV, thus could handle data with R separately), but after turning it on just now, it works as it should!
Thanks guys for the brewpi software and integration with the tilt! Brewing a APA today, with online monitoring of temp and SG…
I finally have the RPI3. I’m doing a fresh install to incorporate your changes. I’ve seem to hit a snag. When I issue this command, sudo setcap cap_net_raw+eip $(eval readlink -f which python)
The response is; Failed to set capabilities on file ‘/home/pi/which’ (invalid argument)
The value of the capability argument is not permitted for a file. Or the file is not a regular non-symlink) file
Any ideas whats going on here?
Hi @sbowler, it may have been the browser cache, I haven’t checked…
As luck would have it, as I wanted to put the tilt in the fermentation vessel, only then I noticed the bottleneck was too narrow…! Thus, while a current batch is fermenting, it’s back to troubleshooting in the physical world…
Actually no. I copied the instruction from a previous message. (they were left out in that) On the Pi I typed it in.
Just a moment ago I started x then navigated to the brewometer-test folder. ran the instruction in a terminal window there. That seemed to work. I can see my Tilt in the test now. It seems that my issue is that I was in the root folder when running the instruction in terminal mode.
@sbowler Thanks for the work you’ve done on this. I managed to get it up and running. now I have a few questions that I can’t find answers for in the above discussion.
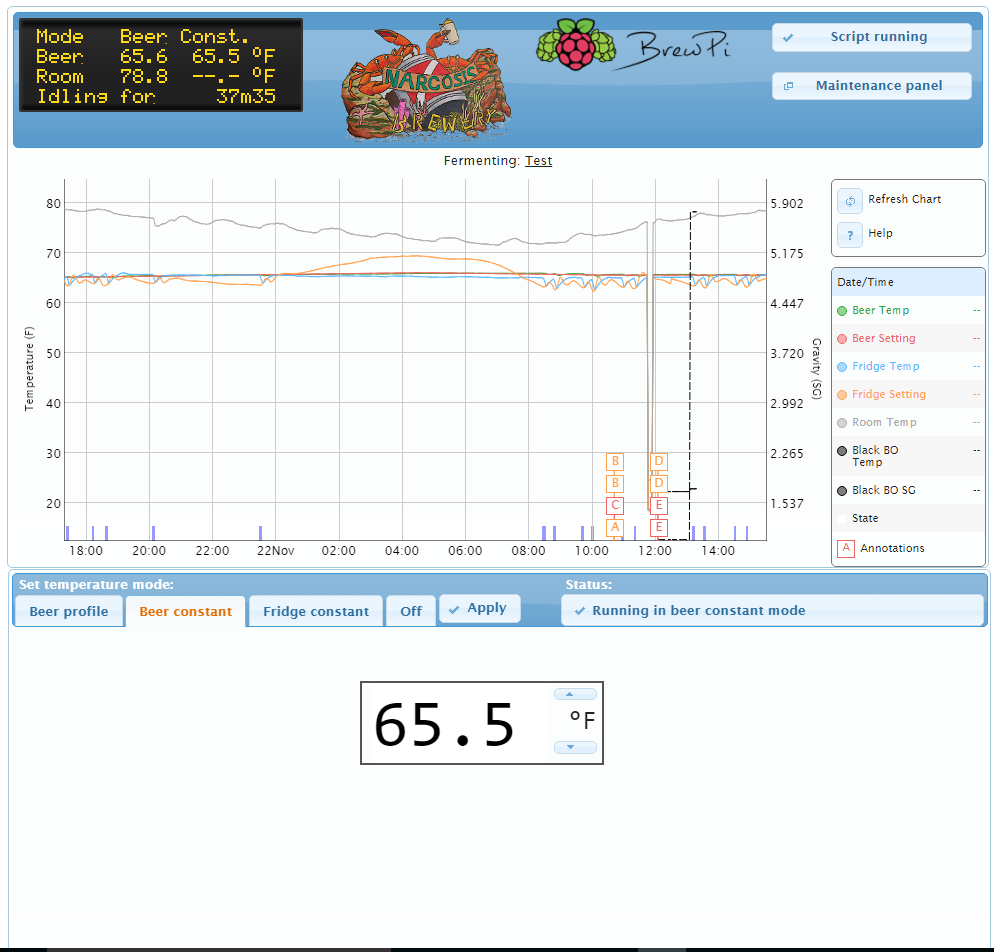
Your mods seem to have disabled the charts ability to switch back and forth from C to F temp format when changed in advanced options. I can see the values change but the tags on the graph, and in the set temperature mode windows remain constant,
I did find an entry in beer-chart.js that will change it but it still remains static. ( ylabel: ‘Temperature (F)’)
as you can see I changed it to F for my chart. How can we make it follow the advanced settings instead?
My second question is why doesn’t my Tilt temp convert to F? Its reading 25 deg which is still C How can I make it read correctly?
To record temperature values from the Tilt in F, you need to change the /home/brewpi/brewometer/settings.ini file and set the FahrenheitTemperatures: False line to read FahrenheitTemperatures: True. Then you’ll need to restart the script to reload the values from that file.
Since I’m running an arduino I am on the legacy branch. So I used this clone. https://github.com/jlvnyc/brewpi-brewometer.
I assume it does not have your latest files then.
In /home/brewpi/brewometer there is no settings.ini only GRAVITY.colour and TEMPERATURE.colour So I added this by copying yours from the repository.
Also I installed your beer-chart.js to replace mine, any other files needed?
There will be other changes, but I haven’t looked at the legacy branch, so I’m not sure. You can do a file by file comparison to work out what changed, but it might be easier to get the maintainer of the legacy repository to rebaseline. Potentially try asking @jvgolf?
It seems to be doing everything I would want at the moment. Still doesn’t convert the brewometer temp to F but I don’t see a need for that sensor anyway.
Thanks for your help.
With respect to the temperature translation, I couldn’t figure out why it wasn’t working for me (it seemed to be ignoring the conversion flag) so I just set it to F because I never use C. I believe* I changed in the brewometer.py file the following:
I don’t know what all changed. @sbowler indicated that he has made a few changes. For example the settings.ini file and the beer-chart.js was changed. Is there a way to compare?
Update brewpi.py to be compatible with the 0.4.4 firmware.
Update references to Brewometer -> Tilt Hydrometer.
When upgrading the source, need to do the following steps:
Rename /home/brewpi/brewometer directory to /home/brewpi/tiltHydrometer
Ensure the existing Brewometer.py file has been deleted (note the code will still work if this file remains - this is just a cleanup step). The Brewometer.py library has essentially been renamed to TiltHydrometer.py.
Very good integration this. Thanks for Sbowler for his code and of course Elco for the excellent brewpi base.
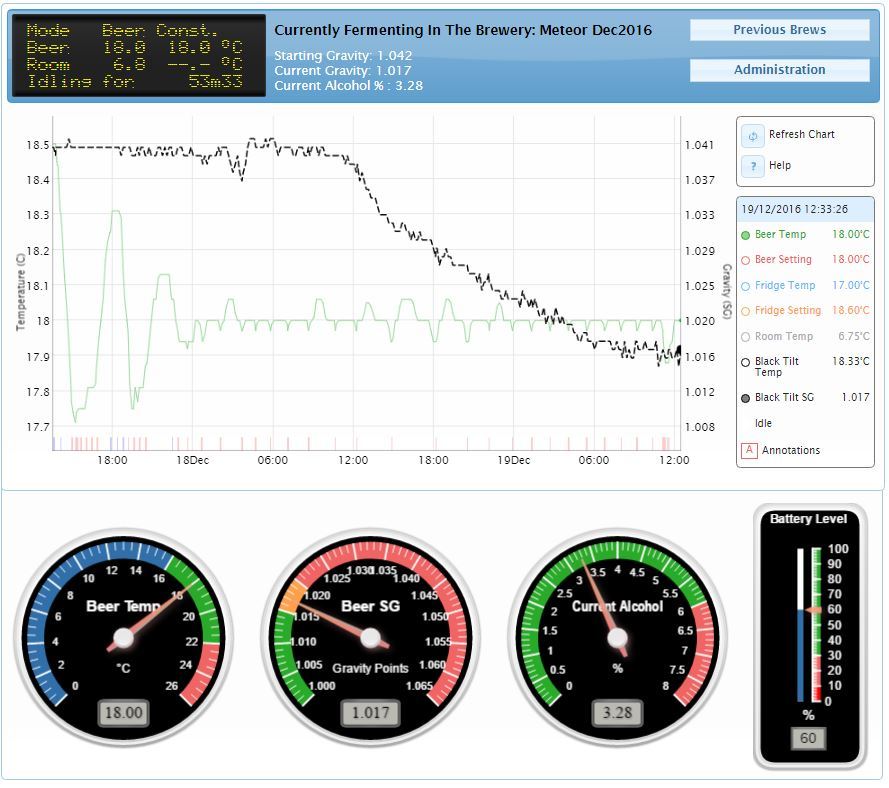
This is my hacked attempt at doing some real time monitoring. This pic was taken exactly 48 hours after pitching. The Tilt is accurate to .1 points (I took a hydro sample and it was 1.018 compared to the Tilt’s 1.017). I can live with that accuracy!
The battery level is taken every 12 hours via Gatttool and stored in my monitoring sqlite database along with the Tilt gravity samples.
sure - I would post my code to github but it is part of a bigger process within my home virtual environment that includes custom monitoring etc based on a sqlite database. I need to spend some time in the new year seeing if I can refactor this into a standard facility as such. Need to think about this as the code base is changing soon via Elco and I am on Arduino.
But in outline:
I created a sqlite database holding a brew/brewlog/brew_device table structure. The brew_device table contains the Tilt address and current battery level reading. This is used for other purposes too - hence the database approach.
I added a new subroutine to the brewpi.py python script that inserts the current tilt SG and temp readings to the new brewlog table every x mins along with the standard brewpi logging data.
I added a new python script that is run via cron twice a day and this runs gatttool to grab the battery status and updates the device table with this.
I wrote a new php page called get_brew_status.php to just return a JSON array of the brew data from the sqlite database upon each call.
I use canvas-gauges javascript library to display the brewtemp/sg/calculated ABV/battery level.
each page or graph refresh updates the canvas gauges and the additional header values via a new javascript function which makes a ajax call to the new php - function getBeerStatus is at the bottom…
Alterations to beer-panel.php for the new header fields as well as making the page public facing without exposing unauthorised admin functions.
function getBeerStatus(){
$.ajax({
    type: "POST",
    dataType:"json",
    cache: false,
    url: 'get_brew_status.php',
    success: function(brewStatusJson){

		var beerTemp=brewStatusJson[0].BeerTemp;

		var tiltSG=brewStatusJson[0].TiltSG;

		var startSG = brewStatusJson[0].StartSG;

		var currentAbv = brewStatusJson[0].CurrentAbv;

		var currentBattery = brewStatusJson[0].BatteryLevel;

		var tempGaugeElement = document.getElementById('beerTempGauge');

		tempGaugeElement.setAttribute('data-value', beerTemp);
		tempGaugeElement.setAttribute('data-animation', "true");

		var sgGaugeElement = document.getElementById('beerSgGauge');
		sgGaugeElement.setAttribute('data-value', tiltSG);

		var abvGaugeElement = document.getElementById('abvGauge');
		abvGaugeElement.setAttribute('data-value', currentAbv);

		var batteryGaugeElement = document.getElementById('batteryGauge');
		batteryGaugeElement.setAttribute('data-value', currentBattery);


		var startSgLineAttr = document.getElementById('abv-line-2');
		var currSgLineAttr = document.getElementById('abv-line-3');
		var currAbvLineAttr = document.getElementById('abv-line-4');

		//update the panel display:
		startSgLineAttr.innerHTML = "Starting Gravity: "+startSG;
		currSgLineAttr.innerHTML = "Current Gravity: "+tiltSG;
		currAbvLineAttr.innerHTML = "Current Alcohol % : "+currentAbv;

	}
 });  //end ajax post.
}
//json object returned by new php page looks like this: