I’m just getting started on BrewPi and the time scale on the graph is a little long.
Is there a way to adjust the timescale on the graph so the graph only spans 2-3 days?
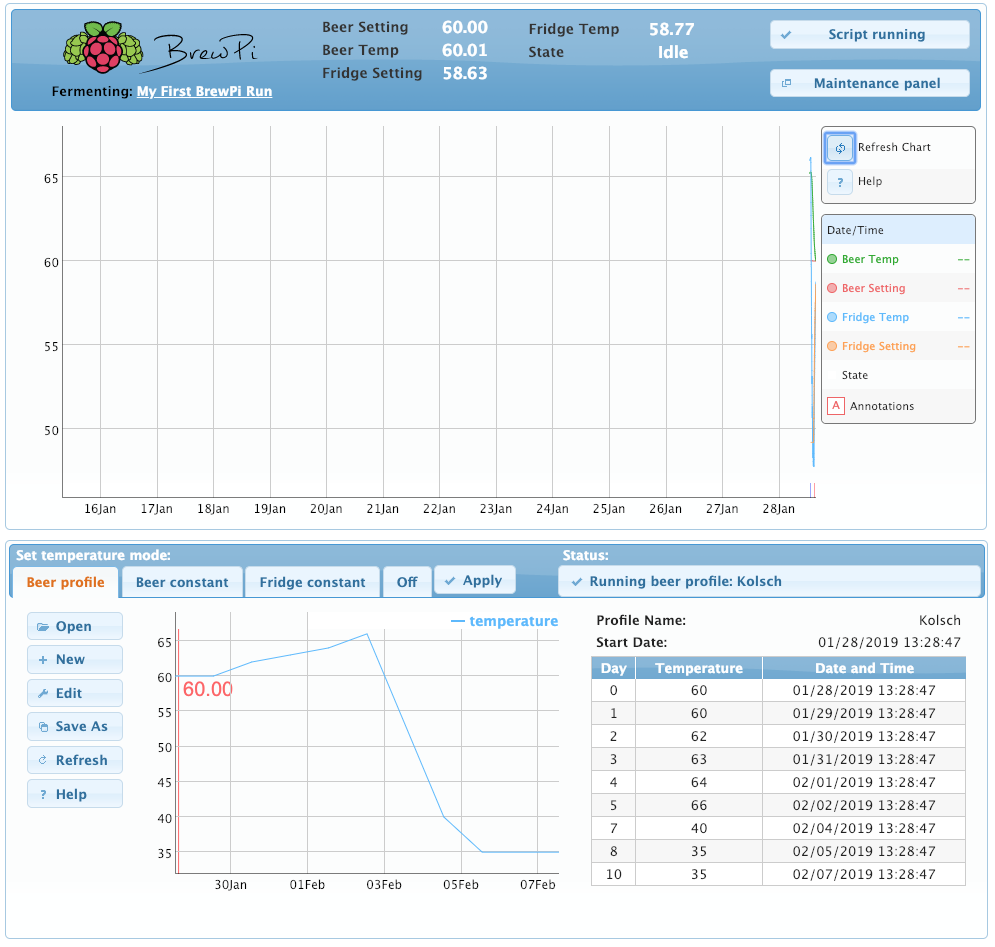
Right now, the lines are very compressed on the right side:
I’m just getting started on BrewPi and the time scale on the graph is a little long.
Is there a way to adjust the timescale on the graph so the graph only spans 2-3 days?
Right now, the lines are very compressed on the right side:
You should start a new brew for each beer by clicking on the beer name, here “My first Brewpi Run”
Thanks for the tip!
I figured out how to expand the graph, just needed to select the area on the graph itself.
Can pinch to zoom on my iPhone, very nice.