Relevant links:
- User guides: https://brewblox.netlify.com/
- Previous release notes: https://brewblox.netlify.com/user/release_notes.html
- Project board: https://github.com/orgs/BrewBlox/projects/1
- Code repositories: https://github.com/BrewBlox
Edge release 2019/11/12
Firmware release date: 2019/11/12
Firmware stability and calendar time
Multiple users were suffering from crashes and hangups most likely caused by bugs in the Wifi system layer.
This release includes a system layer update from particle that that should fix many of these issues.
The Spark now also receives the current time if it connects to the Spark cloud. So if the brewblox service on the pi down, it can still track profiles.
If no cloud connection is used or the Sprak does not have WiFi, it will be able to restore the last system time it recieved from the service from backup memory.
This means that the system time will only be lost on a power cycle. When using only USB, the service swill still set the time.
These changes also mean that the time cannot overflow anymore and long running profiles are not a problem.
Graph configuration
We reworked yet another configuration screen. This time it’s selection of history fields (Graph, Metrics, Session View).
The Graph configuration suffered from being overly detailed.
The history service has no notion of blocks, and allows every individual field to be selected. This requires users to make very fine-grained decisions when selecting data to show.
Settings were also very spread out: adding a single field might require using 3 out of 4 tabs in the settings.
To improve visibility we removed the tabbed layout, and merged the settings in the field tree.
You can now click on nodes to edit their display settings.
New Widget: Session Log
We added a new widget: the Session Log. The goal of this widget is to write down things during a brew day: when did things happen? What was the start SG?
You can export this to printable HTML. It is also the easiest place to keep graphs of sessions, because it has a start and stop button.
The Session Log allows creating a template for your brew day / batch notes.
In the basic view, you can click on a note to edit its value without changing the template settings.
When starting a new session, it will automatically copy the template from the current opened session.
The session consists of a number of notes. You can edit the title and display width for each note in the Full view of the Session log widget.
-
Text notesare multiline editable fields. There’s a button for adding a timestamp, to make it easy to use for logging purposes. -
Graph noteshave two sets of configuration.- You configure the graph fields while creating the template.
- You can import fields from Graph widgets, or other graph notes.
- During the brew day you click on the note to show the graph, or start and stop the period.
You can export sessions to a simple HTML file. Any markdown syntax in text notes will be rendered.
We think that Session Log is a sufficiently big improvement over the Session View widget that it can completely replace it. If feedback is positive, we’ll likely deprecate and eventually remove the Session View widget.
Changes
- Updated Spark system software.
- This fixes multiple bugs that caused crashes or boot loops.
- Reworked the settings component for selecting history data (used in Graph, Metrics, Session View, Session Log)
- Add
Session Logwidget and builder part. - Tweaked the sidebar layout to remove visual clutter.
- Renamed the
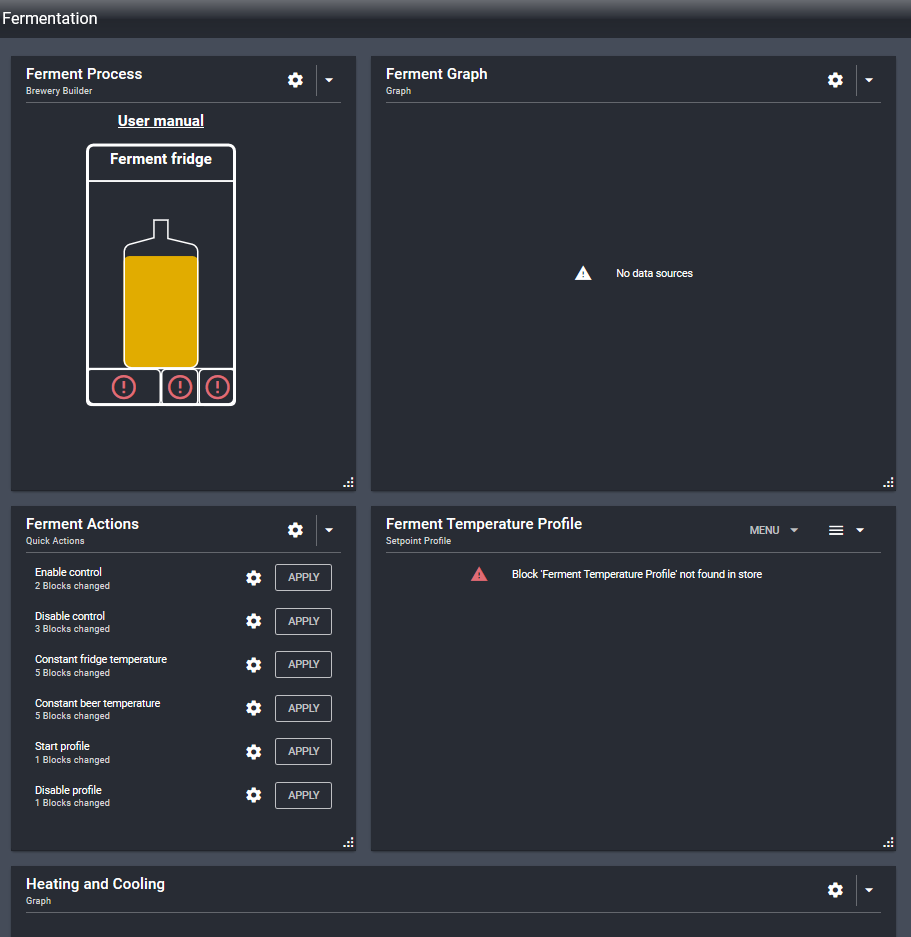
Step Viewwidget toQuick Actions. - Remove prompt to locally preview
brewblox-ctl log. - Fixed a bug where invalid pin assignment would crash generation of the link file when clearing Spark blocks.
- Setpoints now show the enable/disable toggle in the basic display.
- Import graph settings when starting a new session in
Session View - Improved Dashboard wizard.
- ID/URL is now automatically suggested based on chosen title.
- Block dialogs opened by clicking a relation diagram will now initially show the basic display.