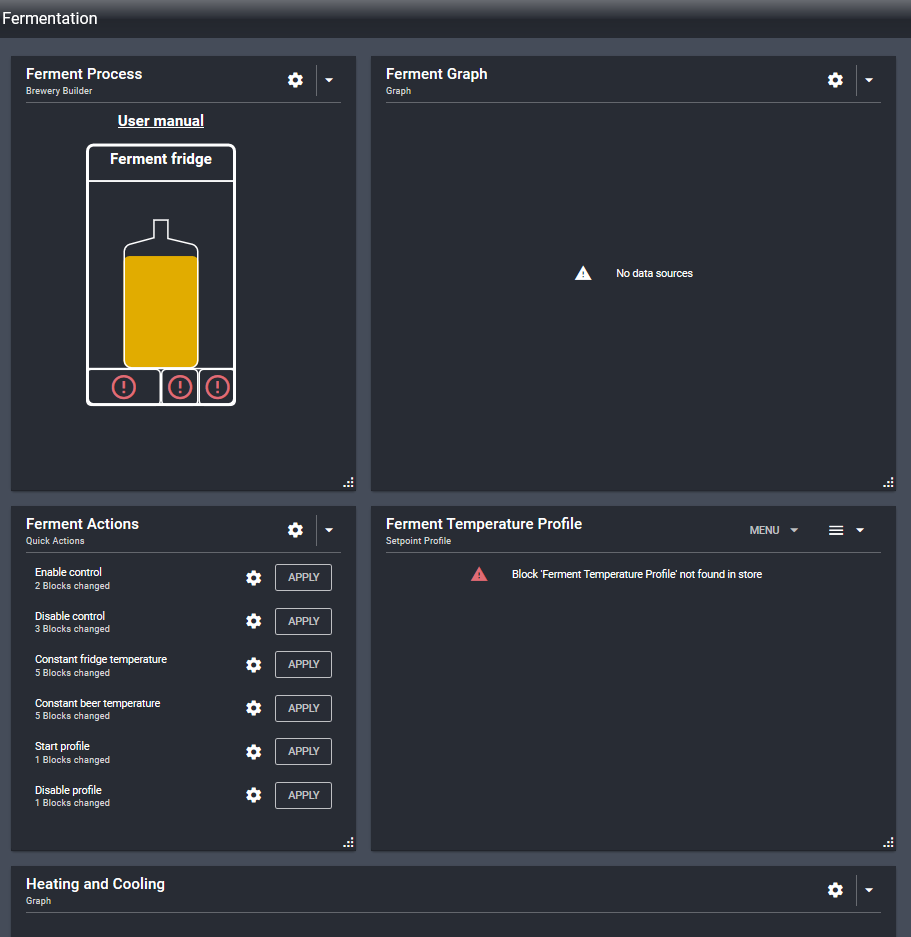
I’ve flashed the firmware and taken the software updates. As partial proof I now see Quick Actions instead of Step View, and Session Log is among my choices for a widget.
Known issues:
Having a hard time actually adding widgets. I get no immediate reaction from the “CREATE” button, and if I eventually cancel out of the dialog I get an on-screen message "Unexpected token < in JSON at position 0"
Can often take a really long time to switch from the spark-one dashboard to my home dashboard, or vice versa.
Very occasionally the creation of a widget succeeds, but for example if I create a Metrics widget and try to add some metrics, when I tick a checkbox it doesn’t actually get ticked. Or the widget claims there are no metrics to show because none have updated in the past 24 hours.
If I try to F5 (refresh) my primary dashboard, Chrome spins the page loading icon seemingly forever. It may eventually refresh after 4 minutes, but more commonly I’ll duplicate the Chrome tab and the new one gets the expected reaction
Metrics/data from my Tilt seem to have gone AWOL
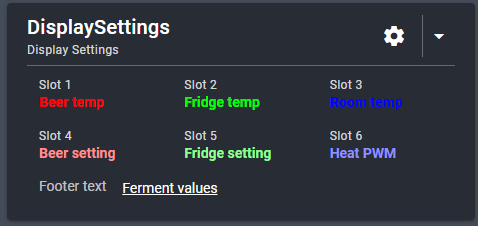
And truly strange: the front panel of my Spark shows temps in C rather than F, even though all other places where temps appear show them in F (screenshot shows the UI version)
That’s very much not supposed to happen (and a new bug). It sounds like it’s having network problems accessing the datastore and history services.
Could you please open your developer console (ctrl + shift + i), and go to the network tab?
When that’s open, refresh the page, and re-run the wizard, until you see the on-screen error message.
Then download the error log (bottom of the sidebar, the bug icon), and right-click on the network tab to download requests as HAR file.
You can see the general page loading problem in this link. At 20s I duplicated the tab, and at 30s I closed the original tab. Once the original tab was closed the page load succeeds as expected:
Here is an example of an errors file from an earlier set of attempts: brewblox-errors (1).json (2.9 KB)
I think that I may have a partial explanation: once I disable BitDefender (AV software) things seem to work more reliably. I will try to reproduce a widget error and then send the related error log.
Better error reporting for parse errors is on my to-do list, but the initial < suggests an HTML response where we expect a JSON payload. Bitdefender injecting some HTML error page does sound plausible.
To disable web page scanning, Bitdefender documentation suggests https://www.bitdefender.com/consumer/support/answer/1519/
If you whitelist the base URL (the part before /ui/, it will cover everything: we let Traefik reverse proxy all service APIs to subdomains under the shared host.
What are the triggers which cause a new cert to get created? Reason I ask: it seems that the overly eager anti-phishing protection from [ BitDefender + Chrome ] conspires to make me go through a cert re-acceptance process whenever the BrewBlox services/containers are spun down and up again. In that case my current steps are:
temporarily turn off BitDefender. Note: creating an exclusion in BitDefender doesn’t seem to be a permanent solution to this problem
refresh BrewBlox UI, thank Chrome for its warning but indicate that I want to continue on to the site
turn BitDefender back on
The fact that the microservices are portable / containerized is cool, but on the other hand failure of the webUI to communicate with the services ends up looking like other types of problem, e.g. that the Spark or Tilt have gone offline.
It’s not a new cert, it’s your browser only creating a temporary exception for the same cert. The BrewBlox installation creates a self-signed cert valid for a year.
As a historic aside: we use https because we need the higher number of simultaneous connections allowed by http2. These are used for block graph, and widget updates.
We can’t automatically use a service like LetsEncrypt because we can’t offer a public-facing URL LetsEncrypt can use to verify the installation residing on your Pi.
You could generate your own externally signed SSL cert, and use it to replace one in brewblox/traefik/. This does require having a public DNS name for validation. After verification you can reroute that name to your Pi.
This approach is certainly not hassle-free, and will likely involve you learning more about SSL certs than you really wanted to know.
It’s an option. You can also add the cert as root certificate in your OS, or generate your own (separate) root certificate, and use that to sign a cert used by brewblox.
An alternative is to disable BitDefender page scanning. It comes down to how valuable the feature is, in terms of effort required to circumvent this false positive.
Hi, I did what seemed like a successful upgrade, but I’m stuck at " Your Spark service is waiting for the controller handshake. This status is usually temporary"
Some users ended up with a bricked Spark after flashing the bootloader. We can fix that, but it requires a hardware debugger - you’d need to mail the controller to us.
It’s a rare bug, but one we never managed to reproduce.
You can use USB for power/data just fine while the Spark has a Wifi connection. It’s also fine for the Spark to have Wifi, USB and the 12V power cable connected at the same time.
The Spark service on the Pi prefers USB connections by default, and will only start scanning for Wifi devices if it can’t find any USB devices.
why not add a button to export the self signed certificate in the settings section to make it easier to get and import into our local root cert store. Maybe an update to the next release?
Adding a cert to your trust store does carry risks. So far we’ve been reluctant to make it an installation step, but improvements to cert creation are on the backlog anyway (autofilling the prompts). We’ll likely then re-evaluate whether to update the guide with instructions on how to trust the cert.
I had this problem today, black screen and yellow blicking light. What I did is just re-install update, re-flash the Spark and reset the wifi. I get everything back in working conditions.