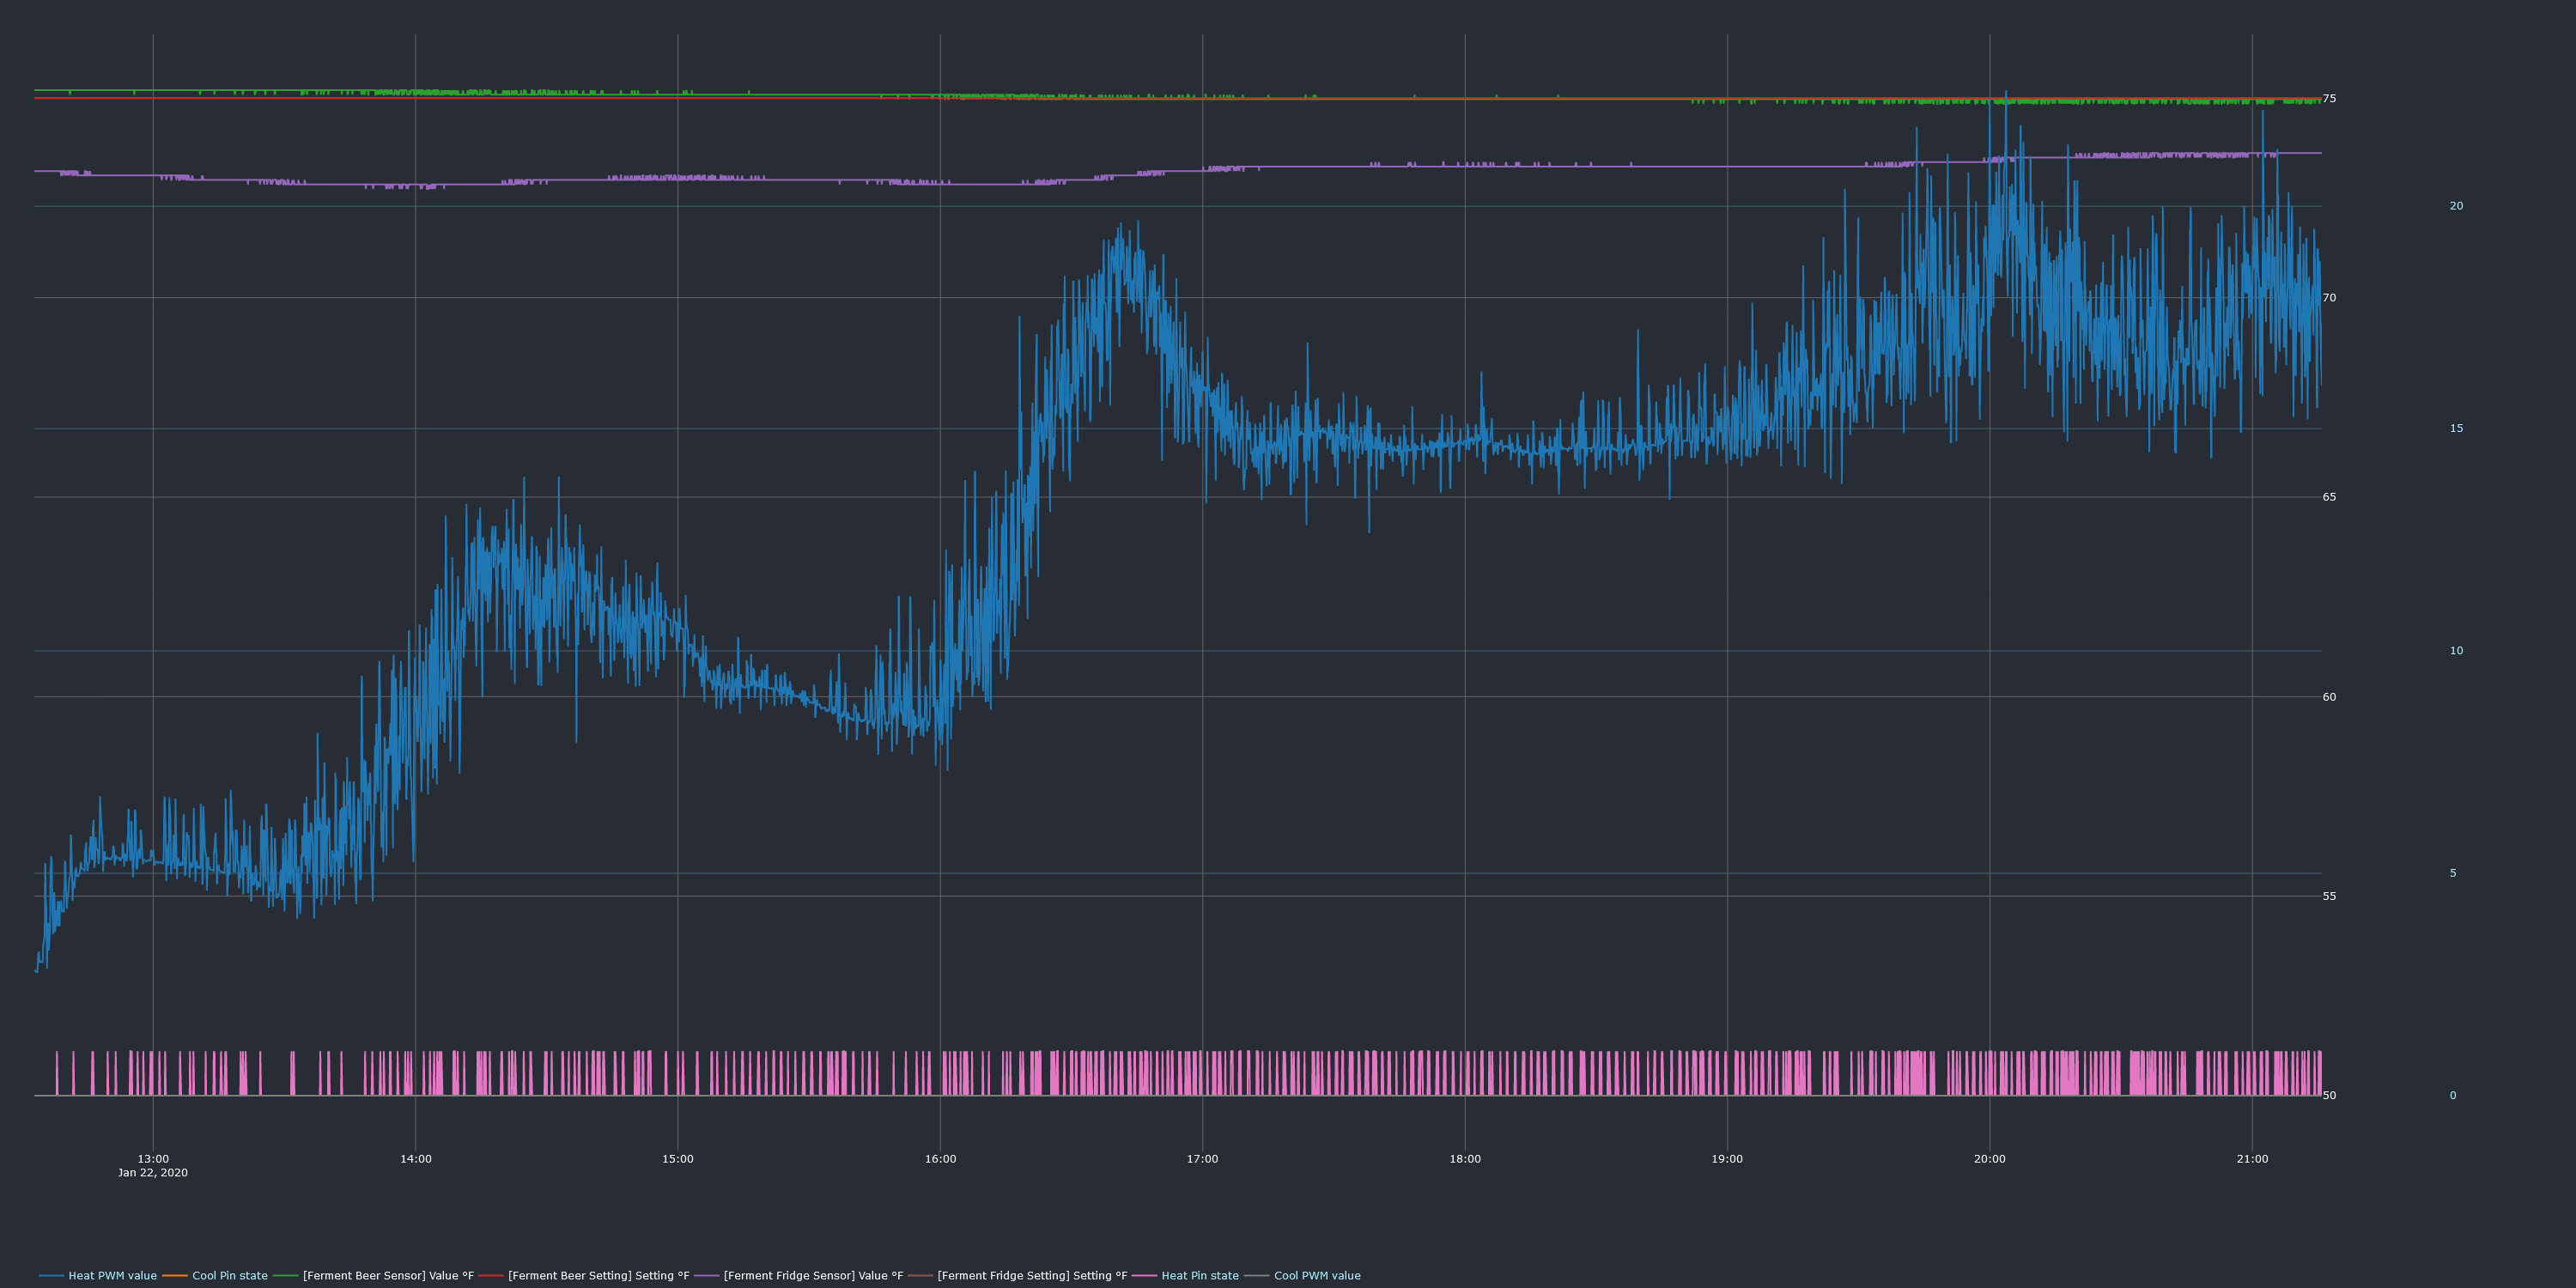
Doing my first test run to see how well tuned the PID defaults are. Was hoping to see how much overshoot, but it seems the graph data only goes back about 9 hours, no matter how far back I set the timespan. Is there a setting somewhere I need to adjust?
Could you please run brewblox-ctl log?
Your log is complaining about Docker logging engines being invalid. It also appears this is a Synology device. Is that correct? How was Docker installed?
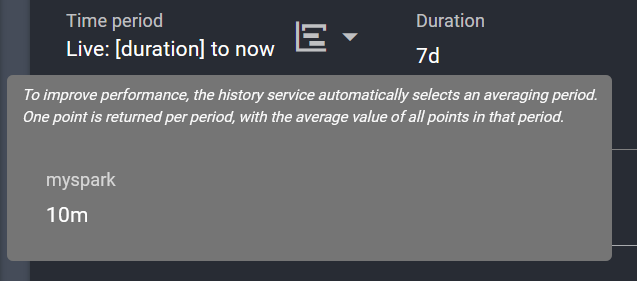
In the UI, if you open the Full version of your graph, and hover over the icon in the start/end selector, what does it say?
It may be a bug in which dataset is giving you data, or the downsampled datasets may be missing.
In your Brewblox directory, could you please run the following command and post the termbin link?
docker-compose exec influx influx -database brewblox -execute "show retention policies; show continuous queries;" | nc termbin.com 9999
One quick thing I should mention is that the graph above was from the 01/02 edge release. The log I submitted was from after I upgraded to the 01/20 edge release. Also, after the upgrade the graph is now showing more than 9 hours of data, but the earlier data is still not there.
That’s correct. It’s a DS713+ with DSM6.2. Docker was installed through package center. I don’t remember selecting any special options, but can’t rule it out. I installed Docker for the purpose of running BrewBlox, so there’s little reason for me to customize it.
I’m not sure I understand what your asking. When I hover over the earliest, data, it shows a timestamp of 21-Jan at 9:30 PM.
All I get it this … I’ll see what I can do to fix that.
ERROR: Couldn't connect to Docker daemon at http+docker://localhost - is it running?

If it's at a non-standard location, specify the URL with the DOCKER_HOST environment variable.
If you click the expand icon in the graph toolbar, it will switch to display a tree view. Above this is a selector for period mode (eg. “Duration to now”), with an icon in it.
Mousing over the icon will show which datasets you’re getting data from.
You may need to prefix the docker-compose command with “sudo” for it to work.
It is possible that something in the install went wrong, and earlier data was lost because it was not copied to a lower-resolution database before the 24h cutoff point of the high-resolution data set.
Here’s the docker-compose exec results
name           duration shardGroupDuration replicaN default
----           -------- ------------------ -------- -------
autogen        24h0m0s  6h0m0s             1        true
downsample_1m  0s       168h0m0s           1        false
downsample_10m 0s       168h0m0s           1        false
downsample_1h  0s       672h0m0s           1        false
downsample_6h  0s       672h0m0s           1        false

name: brewblox
name              query
----              -----
cq_downsample_1m  CREATE CONTINUOUS QUERY cq_downsample_1m ON brewblox BEGIN SELECT mean(*) AS m, sum(/(m_)* Combined Influx points/) AS m INTO brewblox.downsample_1m.:MEASUREMENT FROM brewblox.autogen./.*/ GROUP BY time(1m), * END
cq_downsample_10m CREATE CONTINUOUS QUERY cq_downsample_10m ON brewblox BEGIN SELECT mean(*) AS m, sum(/(m_)* Combined Influx points/) AS m INTO brewblox.downsample_10m.:MEASUREMENT FROM brewblox.downsample_1m./.*/ GROUP BY time(10m), * END
cq_downsample_1h  CREATE CONTINUOUS QUERY cq_downsample_1h ON brewblox BEGIN SELECT mean(*) AS m, sum(/(m_)* Combined Influx points/) AS m INTO brewblox.downsample_1h.:MEASUREMENT FROM brewblox.downsample_10m./.*/ GROUP BY time(1h), * END
cq_downsample_6h  CREATE CONTINUOUS QUERY cq_downsample_6h ON brewblox BEGIN SELECT mean(*) AS m, sum(/(m_)* Combined Influx points/) AS m INTO brewblox.downsample_6h.:MEASUREMENT FROM brewblox.downsample_1h./.*/ GROUP BY time(6h), * END

name: _internal
name query
---- -----
And here’s the hover text I think you’re looking for.
I have terminal captures for my install if it’s helpful, but since it seems to be working OK now, probably no need to pour over them.
Config indeed looks good now. We restore history settings with every upgrade, so it is possible the install went wrong, but the update fixed it.
1 Like