Brewblox release 2021/01/11
Firefox 85.0 (64-bit)
Mac OS 10.13.6
When I look at any graph, I turn off a field, it gets turned back on the very next data update.
More words to make sure I am communicating the concept…
I look at a PID graph.
I turn off viewing of the Input Target and Input Value.
When the data on the graph updates, all fields are graphed again.
Same happens to any graph, including the graph widget.
This behavior is new to me and started with the 2021/01/11 release.
Hi Bob
I am having trouble updating a graph in maximized view without returning to normal view and refreshing the graph? Is the graph update set somewhere?
BR Ken
. Pressing F5 updates the graph which returns to normal mode without panning.
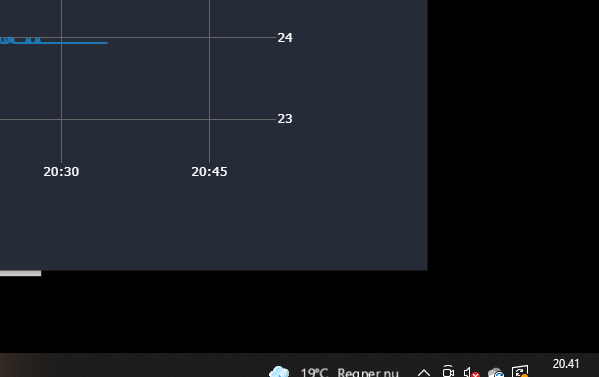
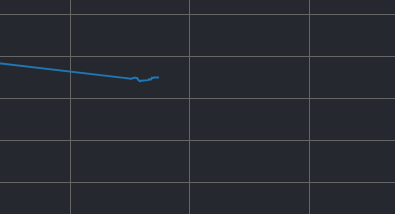
Graph in panned mode
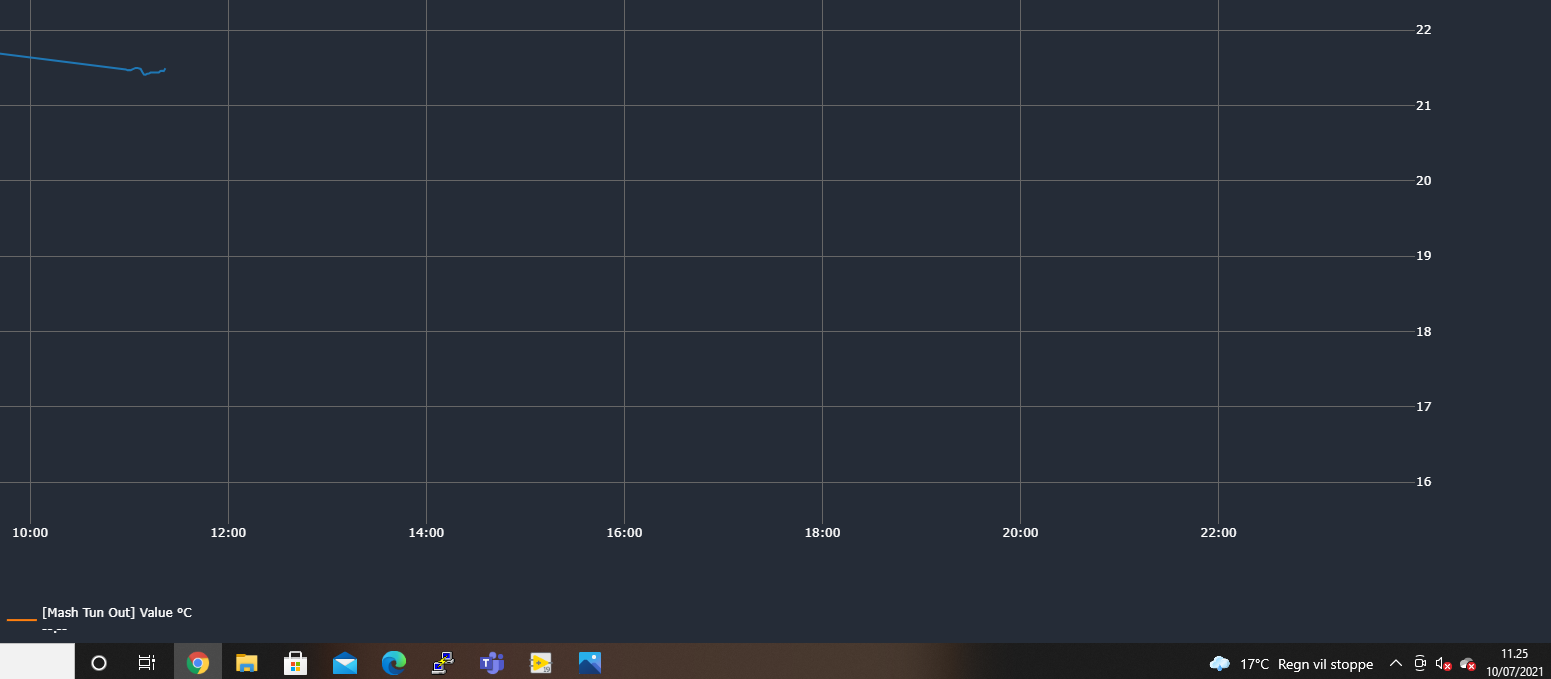
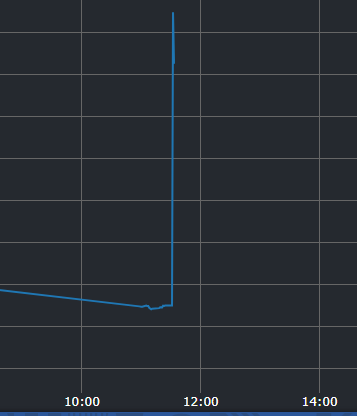
Graph after heating up the sensor and pressing F5 to update. It seems in my case, that BrewBlox stops updating the graph when start panning in either Windows10 and Linux.
Hi Bob,
It makes sense. I just thought that the plotting continued even though the graph was zoomed, which could be useful when regulating the mash temperature manually using the Topsflo TD5 pump.