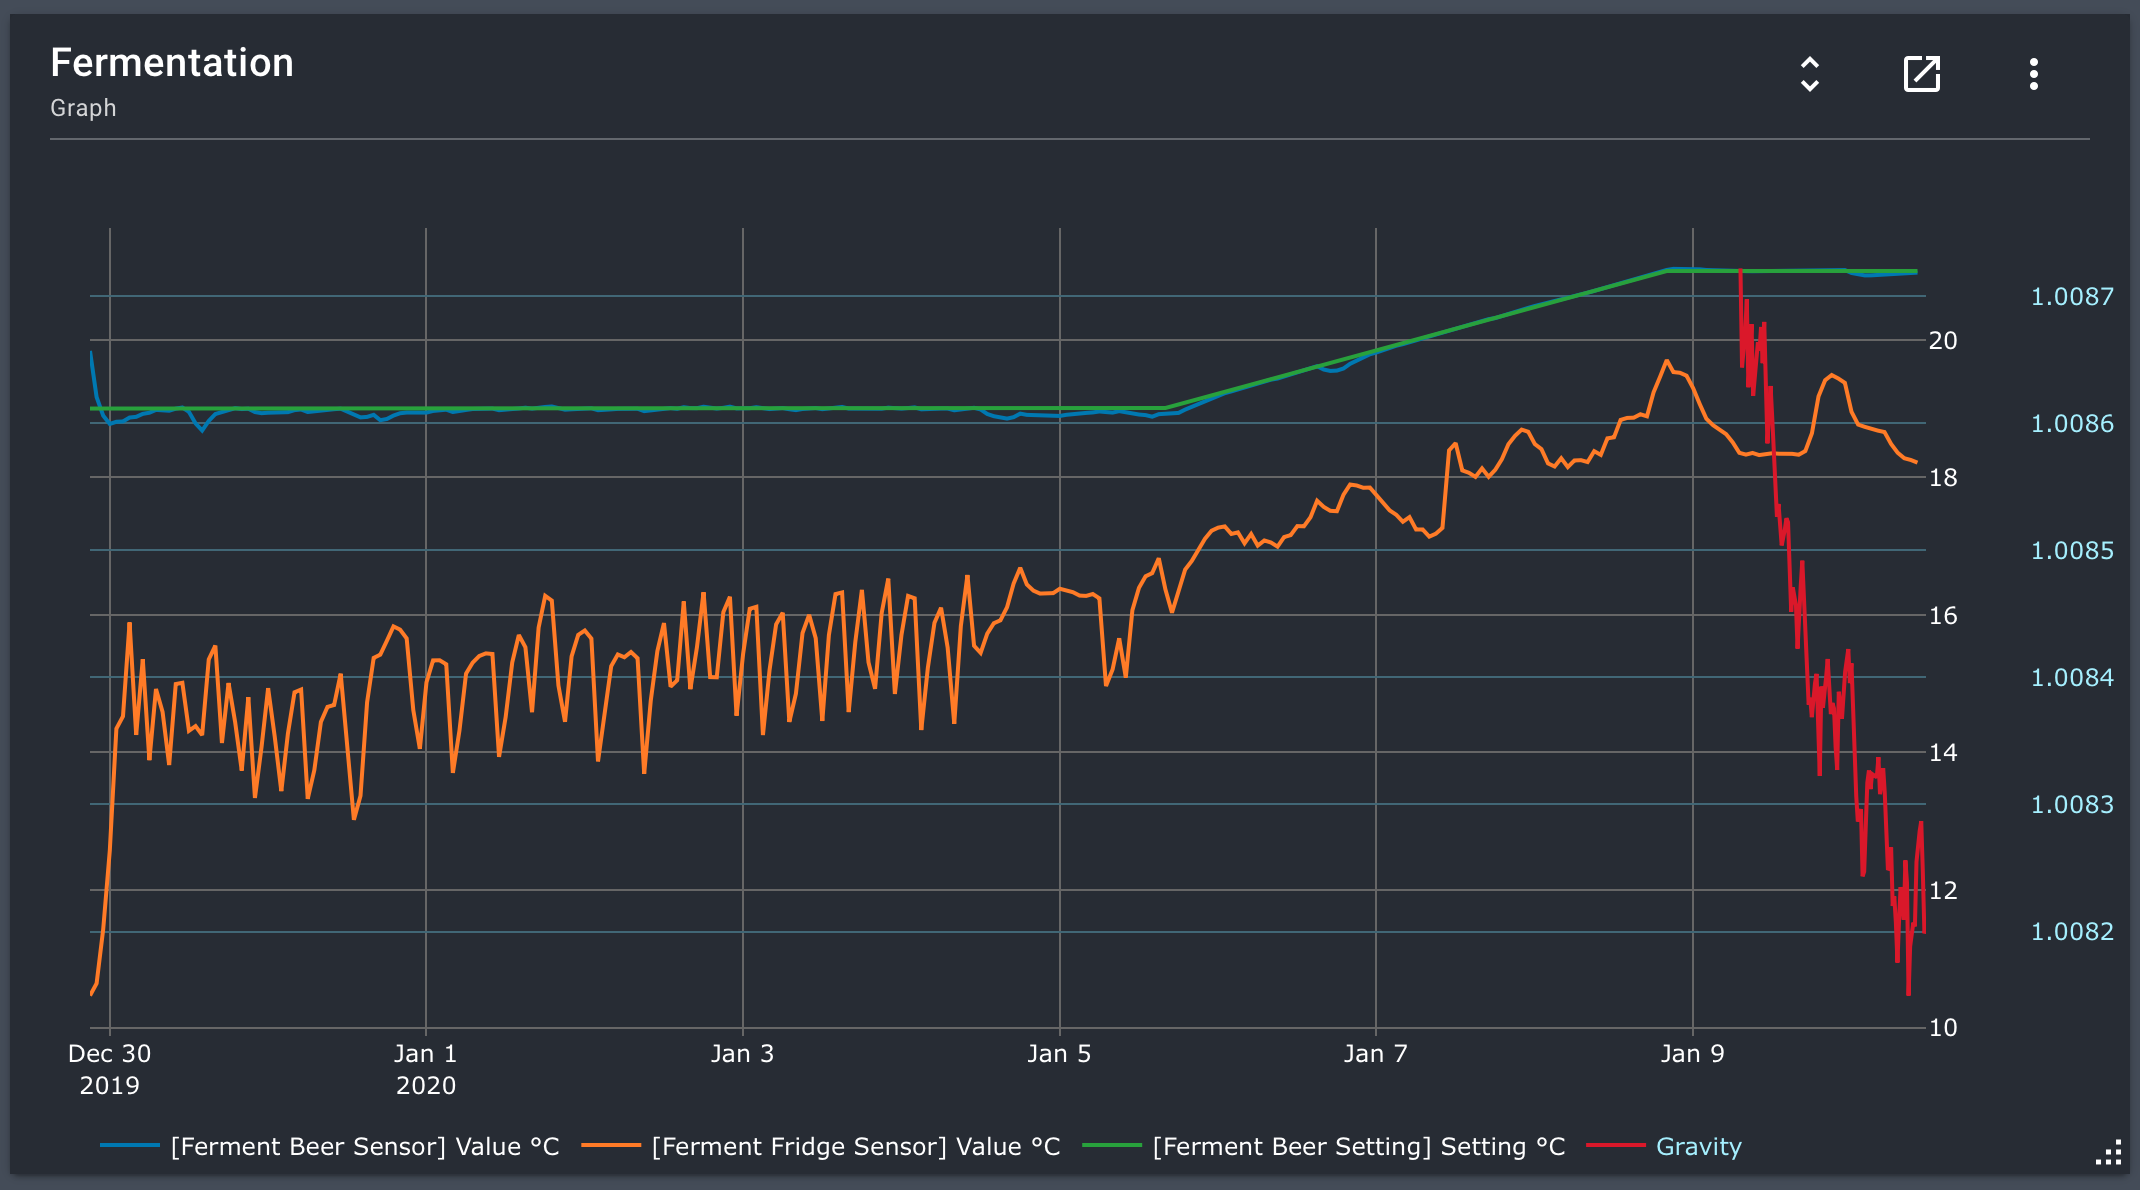
I’m running Brewblox latest version with the iSpindel service from @bdelbosc connected. On my home dahboard I’m showing a graph of the temperature of the beer and the fridge and the gravity input from the iSpindel. I didn’t understand why the gravity graph was missing the beginning and first thought it might be because I restarted brewblox. But as far as I know, I haven’t rebooted or restarted brewblox yesterday.
Graph on my Dashboard
I checked @bdelbosc’s code on Github and can’t figure out why this is happening, since his code is really really simple.
await publisher.publish(HISTORY_EXCHANGE, name, {'temperature': temperature,
                                                     'battery': battery,
                                                     'angle': angle,
                                                     'rssi': rssi,
                                                     'gravity': gravity})
I also had a look at the ‘official’ Plaato service and a service for the Tilt and they are not inserting data in another way (except for using named parameters). Nor could I find anything in the config files for the iSpindel service.
Are we (iSpindel service users) doing anything wrong inserting data or can we do anything different on BrewBlox side to preserve more data?
edit:
I’m querying influx directly via docker-compose and first thought that iSpindel was only persisting the last 100 data points, but now I have 101 data points, so that was a coincidence…
The other lines in your graph seem to be Spark values. If you track the other iSpindel values, does that data have a gap as well?
As you said, the iSpindel service is dead simple. Bugs there are very unlikely.
The most likely cause is either the iSpindel itself not publishing / not reaching the service, or the gravity value being undefined or sent as string.
If non-gravity values are found in the database, the first cause can be ruled out. The second is a bit trickier, and would require additional logging to catch additional occurrences.
as a side note: iSpindel appends a single data point at the time. The history service is responsible for actually writing the database, and will not suddenly truncate at 100 points.
Hi @Bob_Steers,
The other non-gravity iSpindel values have the same cut-off point at Jan 9th 7:10. When querying influx with SELECT * FROM "iSpindelRebel" ORDER BY time ASC LIMIT 5000 I get the points that correspond to the range in the graph. The iSPindel has been running since the beginning of the graph (I’m using [date] to now as data range for the graph. From the moment I started the fermentation)
The other lines are indeed Spark values! They work like a charm.
To add: A few days ago I had roughly the same “length” of the iSpindel graph, roughly two days as well… I can check rebooting Brewblox , but as you said it seems unlikely that once data is written to the history service, it gets truncated on a restart
Hi, how strong is your RSSI signal?
Also, docker-compose logs ispindel should trace what has been received,
if there is no trace before Jan 9th, maybe the signal was too weak?
Thanks for the suggestion @bdelbosc, the log file is actually showing older data incoming! (I was already doubting myself)
Log sample:
ispindel_1   | 2020/01/03 15:49:12 INFO     __main__                        iSpindel iSpindelRebel, temp: 19.1875, gravity: 1.0147537343836475
ispindel_1   | 2020/01/03 16:03:36 INFO     __main__                        iSpindel iSpindelRebel, temp: 19.25, gravity: 1.0149080146160496
ispindel_1   | 2020/01/03 16:18:01 INFO     __main__                        iSpindel iSpindelRebel, temp: 19.25, gravity: 1.0148159879071912
ispindel_1   | 2020/01/03 16:32:26 INFO     __main__                        iSpindel iSpindelRebel, temp: 19.3125, gravity: 1.014449836794166
ispindel_1   | 2020/01/03 16:46:52 INFO     __main__                        iSpindel iSpindelRebel, temp: 19.375, gravity: 1.0146932829941795
ispindel_1   | 2020/01/03 17:01:18 INFO     __main__                        iSpindel iSpindelRebel, temp: 19.375, gravity: 1.014684231124756
ispindel_1   | 2020/01/03 17:15:43 INFO     __main__                        iSpindel iSpindelRebel, temp: 19.375, gravity: 1.0143015083003009
ispindel_1   | 2020/01/03 17:30:09 INFO     __main__                        iSpindel iSpindelRebel, temp: 19.4375, gravity: 1.0146137060022753
ispindel_1   | 2020/01/03 17:44:34 INFO     __main__                        iSpindel iSpindelRebel, temp: 19.4375, gravity: 1.015644707898956
ispindel_1   | 2020/01/03 17:58:59 INFO     __main__                        iSpindel iSpindelRebel, temp: 19.4375, gravity: 1.015540917403156
ispindel_1   | 2020/01/03 18:13:24 INFO     __main__                        iSpindel iSpindelRebel, temp: 19.4375, gravity: 1.0150313184519915
The log is written after the publish call, so the publish should have succeeded to write the log
Could you please run brewblox-ctl log? That will let us take a look at all logs.
The whole thing is rather baffling though: if the eventbus / history service / database were having issues, we’d also see a gap in Spark data.
It may be a data type issue in the database that fixed itself after the shard expired. (we progressively downsample the database, and only keep real-time data for 24h).
This would happen if gravity in the first published point was a string value.
It’s not a very strong theory: I don’t believe the iSpindel ever returns strings. Logs may show some light.
https://termbin.com/0xv9
I was thinking of a similar reason reading about aggregating data in another topic. Anyway I can check? if it is not in the logfiles?
Edit: I just lost more data. So an aggregation issue sounds not so weird to me at the moment!
In influx, show field keys from "iSpindelRebel" will show data types.
show shards will show all shards in the database. You’re looking for those with retention policy “autogen”.
Do you have a gap in your data matching the stard/end times of one or more shards?
No gaps, but the issue might be there. the oldest record when querying iSpindelRebel corresponds to the start_time of the oldest shard.
108 brewblox autogen          108         2020-01-09T12:00:00Z 2020-01-09T18:00:00Z 2020-01-10T18:00:00Z
109 brewblox autogen          109         2020-01-09T18:00:00Z 2020-01-10T00:00:00Z 2020-01-11T00:00:00Z
110 brewblox autogen          110         2020-01-10T00:00:00Z 2020-01-10T06:00:00Z 2020-01-11T06:00:00Z
112 brewblox autogen          112         2020-01-10T06:00:00Z 2020-01-10T12:00:00Z 2020-01-11T12:00:00Z
113 brewblox autogen          113         2020-01-10T12:00:00Z 2020-01-10T18:00:00Z 2020-01-11T18:00:00Z
Can it be that the data is not correctly aggregated? Oh… wait a minute. How are the fields set? I have send a first record from the command line to test the integration with the iSpindel that was not coming directly from the iSpindel itself. Might that have corrupted my database?
The fields from “iSpindelRebel” are:
> show field keys from "iSpindelRebel"
name: iSpindelRebel
fieldKey                fieldType
--------                ---------
 Combined Influx points integer
angle                   float
battery                 float
gravity                 float
rssi                    integer
temperature             float
And I send:
{"name":"Red","ID":11756011,"angle":76.36908,"temperature":23.9375,"battery":4.056309,"gravity":76.36908,"interval":300,"RSSI":-69}
Hmm… no strings there
Fields are created based on data sent. New fields can be added to an existing measurements.
For the eventbus -> influx key conversion, see https://brewblox.netlify.com/dev/reference/event_logging.html#data-structure
I do have a hunch that it may be something else: you may be sitting on an edge case where our downsample selection math derped out and gave you the wrong set.
When the UI requests data, the history service checks which downsampling policy contains the optimal number of fields. It selects the one that will yield approximately 200 points.
Your logs do show you always getting data from the “autogen” policy, with actual points between 100 and 120. It may be that even without the discarded shard, the downsample_1m policy has less data.
You could check this by selecting data from "brewblox"."downsample_1m"."iSpindelRebel" where timestamp is before the gap end.
1 Like
I have data going back to Dec 21st
2019-12-21T14:00:00Z 1                         83.81982 3.524505  1.6677669461852362  -67    43.1875
2019-12-21T14:14:00Z 1                         83.75235 3.404588  1.6645749892255717  -67    41.9375
2019-12-21T14:29:00Z 1                         83.79908 3.357664  1.6667846311350258  -66    40.625
I do have one empty row, but not at the beginning of my graph gap
2020-01-07T04:10:00Z 1                         47.32233 3.7122    1.0097764115789307  -64    20.25
2020-01-07T04:39:00Z 1                         47.2369  3.7122    1.0096453484357455  -64    20.25
2020-01-07T04:53:00Z 1
2020-01-07T05:08:00Z 1                         47.2425  3.7122    1.0096538961846788  -64    20.25
2020-01-07T05:22:00Z 1                         47.25142 3.7122    1.0096675240525244  -64    20.25
and some rows missing one or two values.
Think that confirms it, especially given how sparse the data is: the iSpindel appears to send updates every 15 minutes.
For starters, I’ll add some button in the graph to enforce the use of 1m downsampling.
As a more permanent fix, I’ll have a look at how to improve the policy selection. Given how data interval is completely arbitrary between services (and may contain gaps), this will require some careful consideration to handle all edge cases.
Correct! Switching to 30 mins makes it even worse I guess? Thanks for your help and potential quick fix!
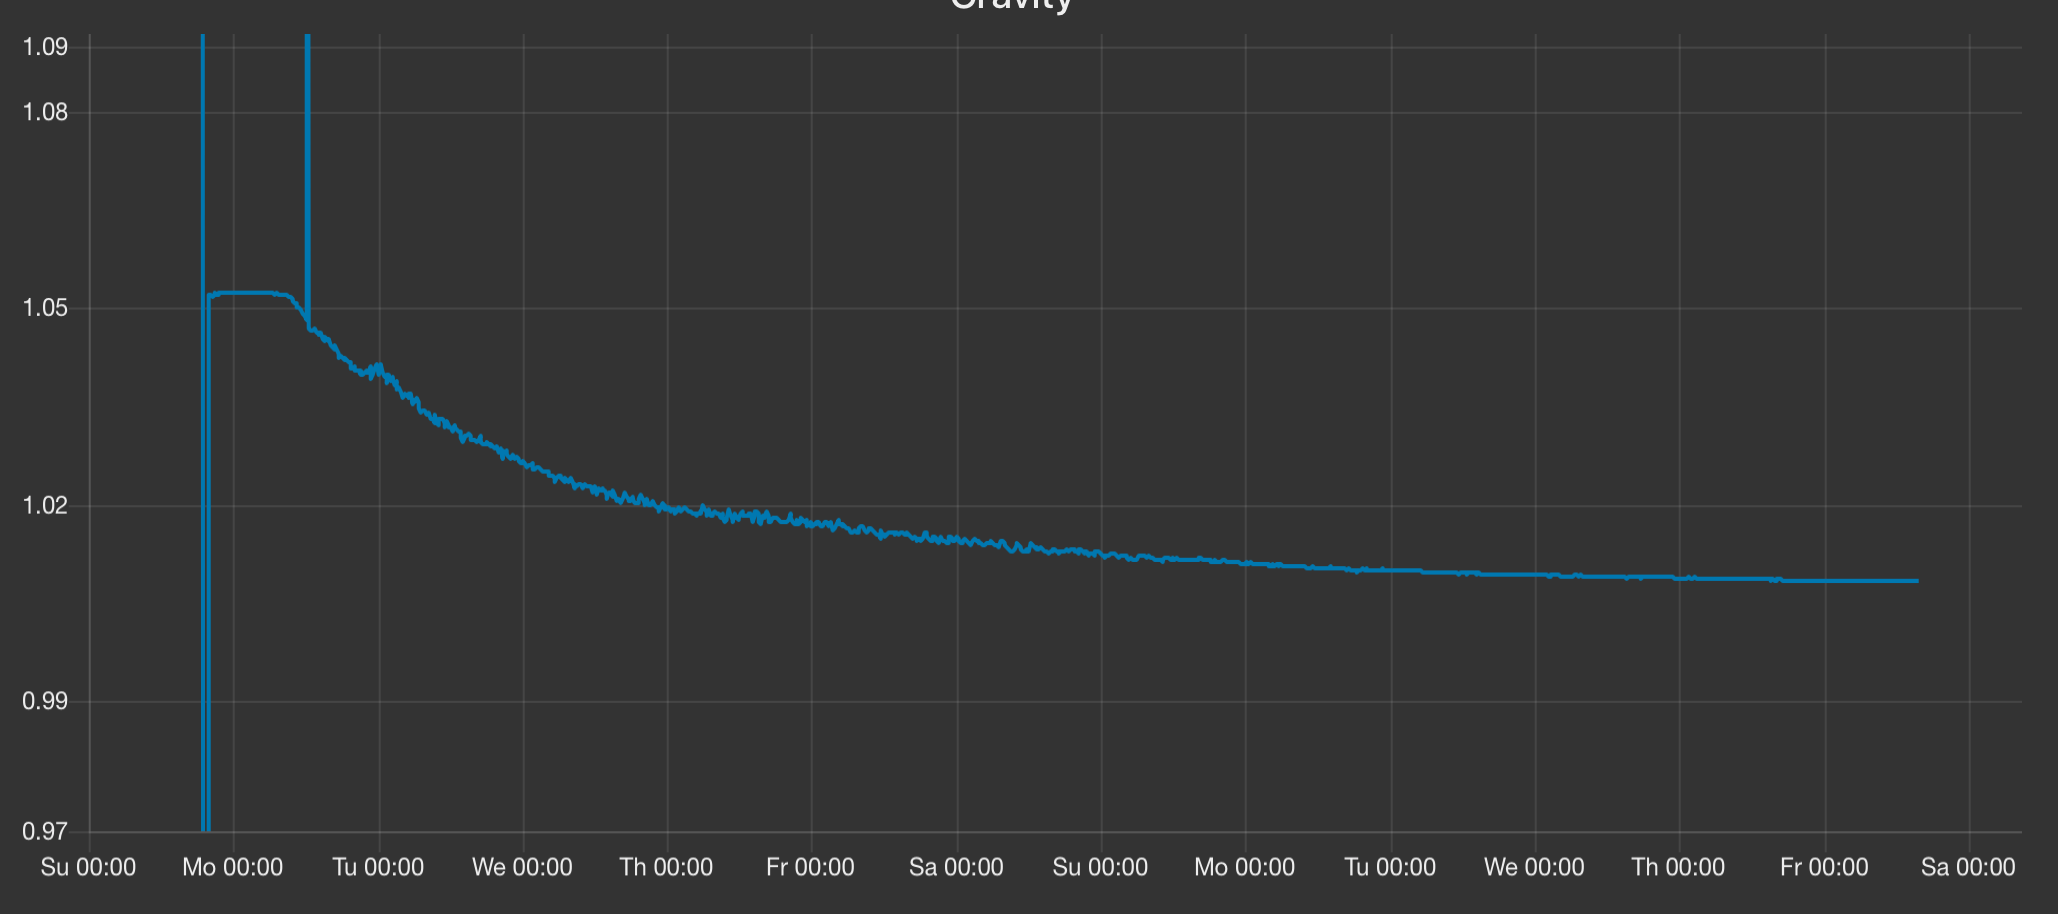
Having figured out the source of my problem, I have another feature request for the graphs  I would LOVE to be able to set the range of the Y-axes to dampen the minor fluctuations of temperature and gravity. I’m for example also logging my gravity readings to NodeRed and set the range from 0.996 to 1.100
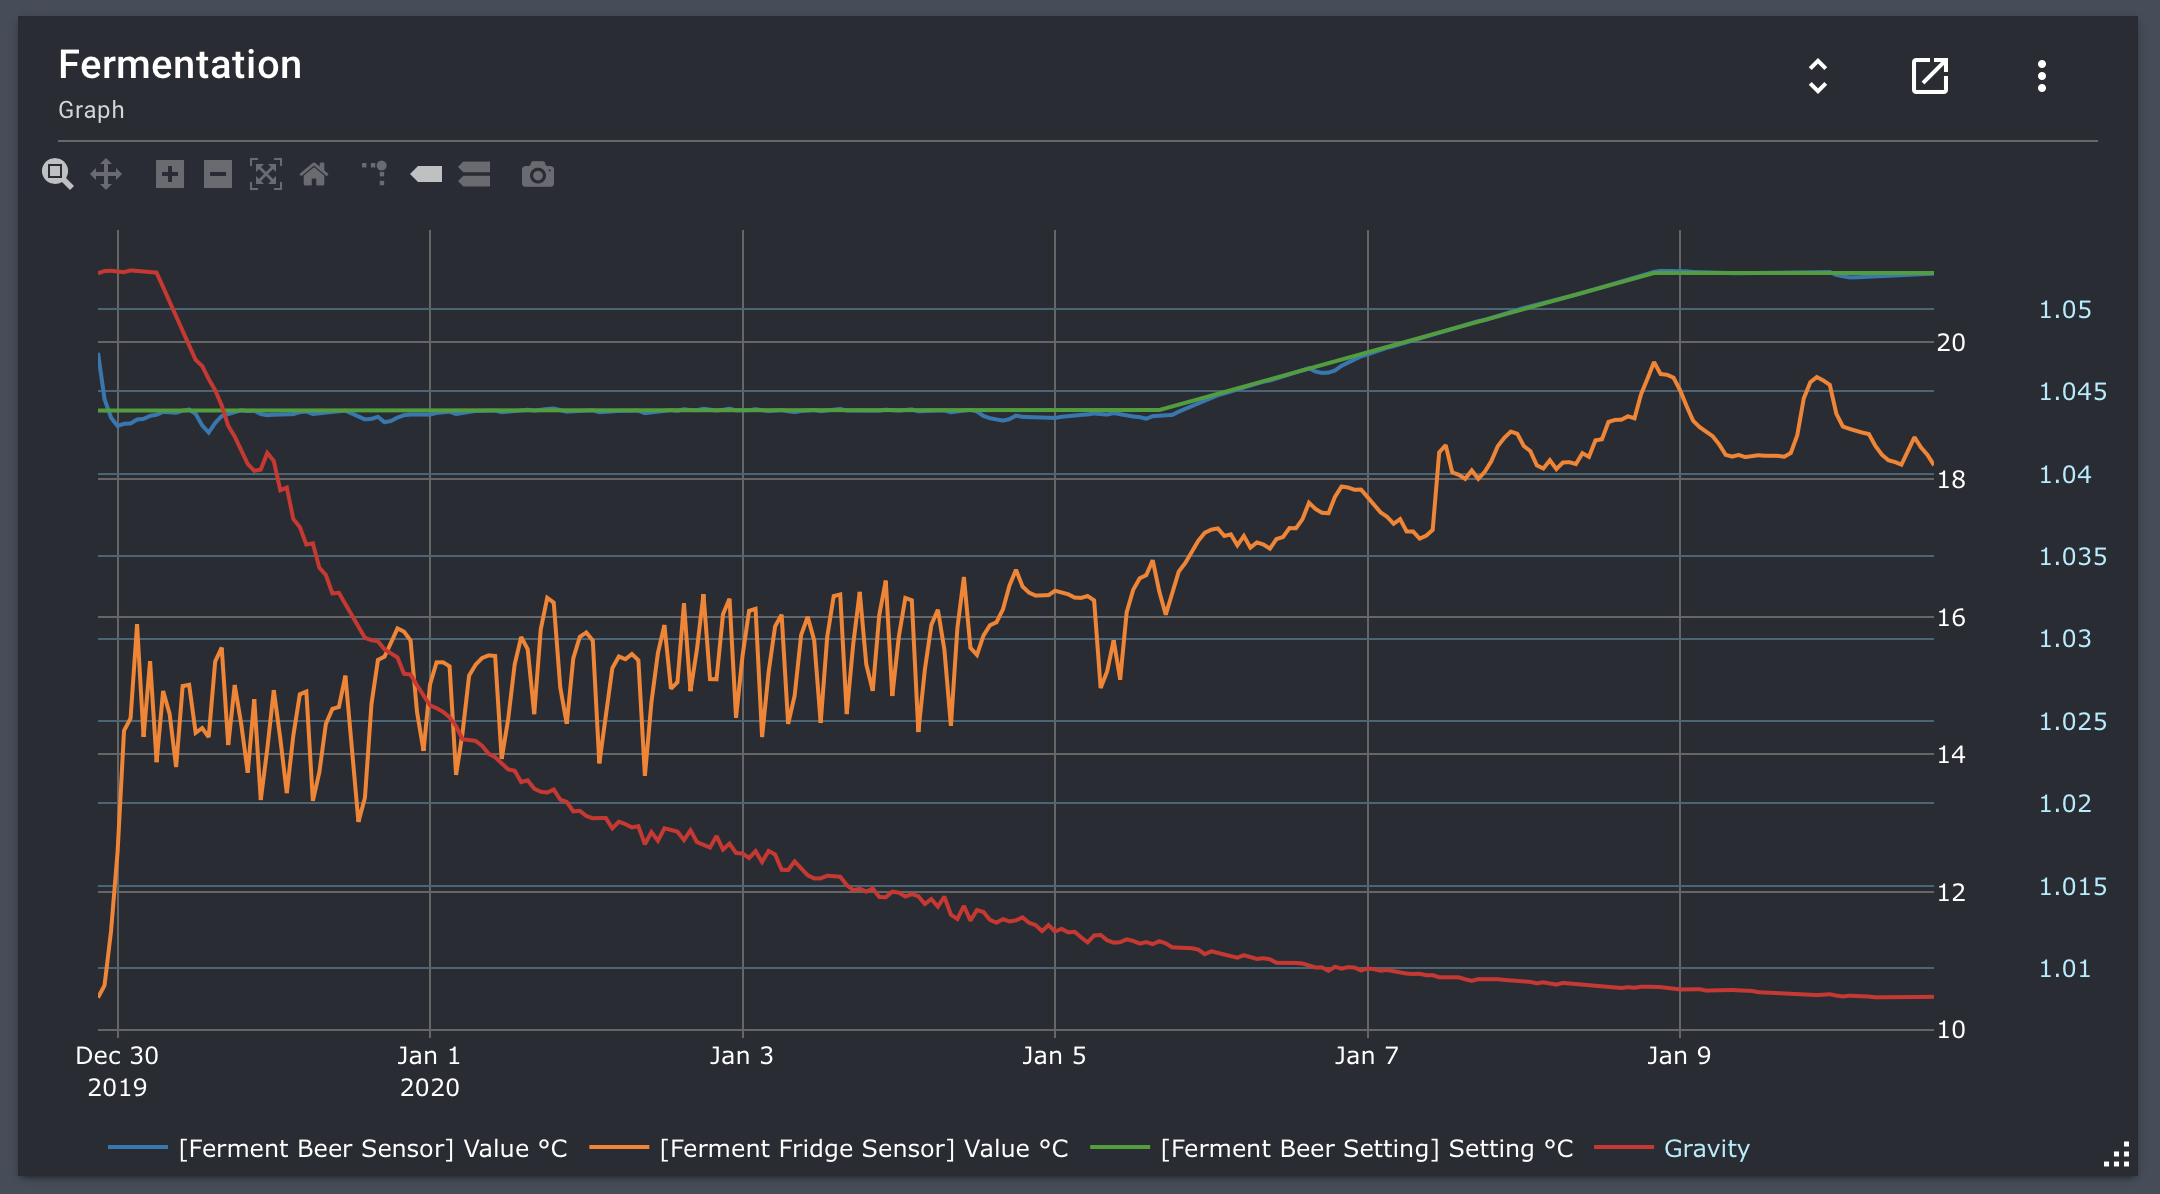
Same happens when the temperature is handled very precisely by the Spark (when it fluctuates by around 0.1 degrees), it looks very serious, while in practice it is almost a flat line when you think of the temperate in a range from 0 to 30 degrees.
(I seem to remember that in the previous Graph version, the more complicated one, this was possible? Or am I imagining things).
Not a high priority though…
I’ll add an issue for configurable Y-ranges. No guarantees on that one though: the UI still has problems with having way too many settings. We want to carefully consider the added value of new config fields.
On further thought, I think the bug may actually be a bit more straightforward. Writing some test cases to confirm now.
[disregard section below if you don’t care about details]
https://github.com/BrewBlox/brewblox-history/blob/eddad0c24d136c293f35c87afbf8aab1debf6075/brewblox_history/queries.py#L217 is iterating over the results of how many points would be yielded by each policy.
-
approx_points is the “best” amount.
-
count is how many points would be yielded by this downsampling policy.
-
best_count is the value yielded by the current favorite.
While it will adjust the chosen policy downwards (count >= approx_points and count < best_count) it’s missing a condition for when the first result (autogen) has less than approx_points.
I think if I add or (best_count < approx_points and count > best_count) your problem may be solved.
1 Like
All I can ask for!
If you want me to test this fix, let me know! Happy to help out
Fix will be part of the next release. If you want to try it before then:
- Edit
docker-compose.shared.yml
- Edit the
image key for the history service.
- from:
brewblox/brewblox-history:rpi-${BREWBLOX_RELEASE}
- to:
brewblox/brewblox-history:rpi-develop
Save, exit the editor, and run the following commands:
docker-compose pull history
docker-compose stop history
docker-compose up -d
Refresh the UI, and the gap should have disappeared.
I do recommend reversing the edit to docker-compose.shared.yml before you update to the next release.
1 Like
You made me really happy! Thank you for the extremely quick fix 
1 Like
Thank you for all the database digging =D
I learned a lot! And that is always nice, to further understand the system that you are using