Remove wrong Tilt-data points

I’m running BrewBlox with two conicals and a Tilt in each of them. I am very satisfied with the new system. The only thing is, that sometimes I get some stupid data points from Tilt. With theses points the whole graph is not readable anymore. Here an examle:

Graph with Tilt Data:

Graph without Tilt data:

The wrong data point is about -57 thousand, so the scale of the graph is adopted to the most extreme points.
Is there a possibilty at the Moment to delete single data points out of the database.

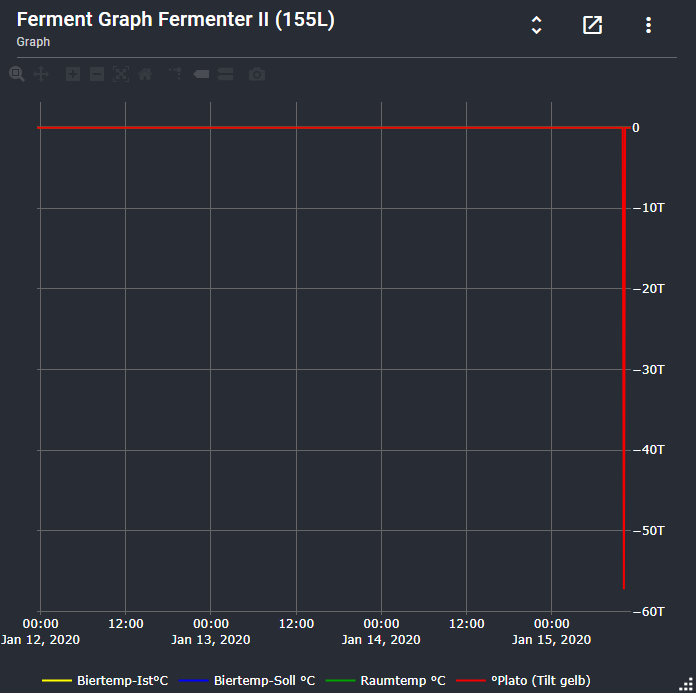
It’s possible to manually remove points from the database.

You’ll need the exact point name.

  • Expand the graph settings.
  • Find the point, and click on it to open its settings in a dialog.
  • The title of the dialog is the full name, but it includes service name. Example: tilt/Yellow/Plato[degP]

In your BrewBlox dir, run

docker-compose exec influx influx -database brewblox

This will connect to the InfluxDB shell. You can run database queries here.

select time, "Yellow/Plato[degP]" from "brewblox"."autogen"."tilt" where "Yellow/Plato[degP]" < -10000000

In this query, put the service name (before the first /) in the "brewblox"."autogen"."tilt" section (replace tilt), and use the part after the first / in the rest of the query.

Example output (different keys)

> select time, "mock-sensor-2/value[degC]" from "brewblox"."autogen"."sparkey" where "mock-sensor-2/value[degC]" = 22
name: sparkey
time                mock-sensor-2/value[degC]
----                -------------------------
1579086099122998000 22
1579086104149512000 22
1579086109172633000 22

Copy the “time” value, and run:

delete from tilt where time = 1579086099122998000

Replace the long number with the time value you copied.

Repeat the process for downsampled databases:

select time, "Yellow/Plato[degP]" from "brewblox"."downsample_1m"."tilt" where "Yellow/Plato[degP]" < -10000000
select time, "Yellow/Plato[degP]" from "brewblox"."downsample_10m"."tilt" where "Yellow/Plato[degP]" < -10000000
select time, "Yellow/Plato[degP]" from "brewblox"."downsample_1h"."tilt" where "Yellow/Plato[degP]" < -10000000
select time, "Yellow/Plato[degP]" from "brewblox"."downsample_6h"."tilt" where "Yellow/Plato[degP]" < -10000000

You can always run delete from "tilt" where time = XXXXXXXX, regardless of where the downsampled data came from.

If this happens more often, it’d be better for @j616s or us to do some input sanitation.

Also worth noting you can zoom in on the vertical axis of the graph by click & dragging the range. It won’t help in this case, but I also keep things like gravity and PWM values on a separate y-axis to temp as they tend to fall in a different range. I’ll stick input sanitation on the list of jobs. Usual warning of it being a hobby project for me and having little time to put to it atm, though :slight_smile:

Thank’s for your tips. I found some negative data points and removed them by using the delete-command. In the downsampled databases I didn’t find any special data point. But nothing changes in the graphs (neither after rebooting the system).
Do you have an idea, where this comes from.

I forgot to take into account that in downsampled databases, the key name is not the same.

Due to a limitation in Influx, every level of downsampling has keys prefixed with “m_”. The prefix is repeated for higher levels.

So the correct queries for downsampled databases would be:

select time, "m_Yellow/Plato[degP]" from "brewblox"."downsample_1m"."tilt" where "m_Yellow/Plato[degP]" < -10000000
select time, "m_m_Yellow/Plato[degP]" from "brewblox"."downsample_10m"."tilt" where "m_m_Yellow/Plato[degP]" < -10000000
select time, "m_m_m_Yellow/Plato[degP]" from "brewblox"."downsample_1h"."tilt" where "m_m_m_Yellow/Plato[degP]" < -10000000
select time, "m_m_m_m_Yellow/Plato[degP]" from "brewblox"."downsample_6h"."tilt" where "m_m_m_m_Yellow/Plato[degP]" < -10000000

Yes, those prefixes are really annoying.

You should see changes immediately after pressing F5 in the UI. Rebooting the system is not necessary.

Thank’s @Bob_Steers. That worked, my graphs are clean again.

1 Like

Bob - is there a way to set a max and min on the graph - e.g. max @ 1.1 or 1.2 and min @ 1.0? (aside from just manually zooming). I just set up my tilt on BrewBlox today and am seeing some of the same. Thanks.

Completely forgot I had a PR to review with a fix for this in the Tilt service. Will try and get it merged later on today and let you know where its ready.

There’s an issue for manual graph ranges on the backlog. A feasibility check is planned for monday: we’ll add it unless it requires major rewrites to how graph config is handled.