I am looking for a little bit of hand holding. I have to confess that I bought the system simply to monitor temperature of fridges. Nothing else. I have 5 sensors that I wish to use and they are all connected to the spark.
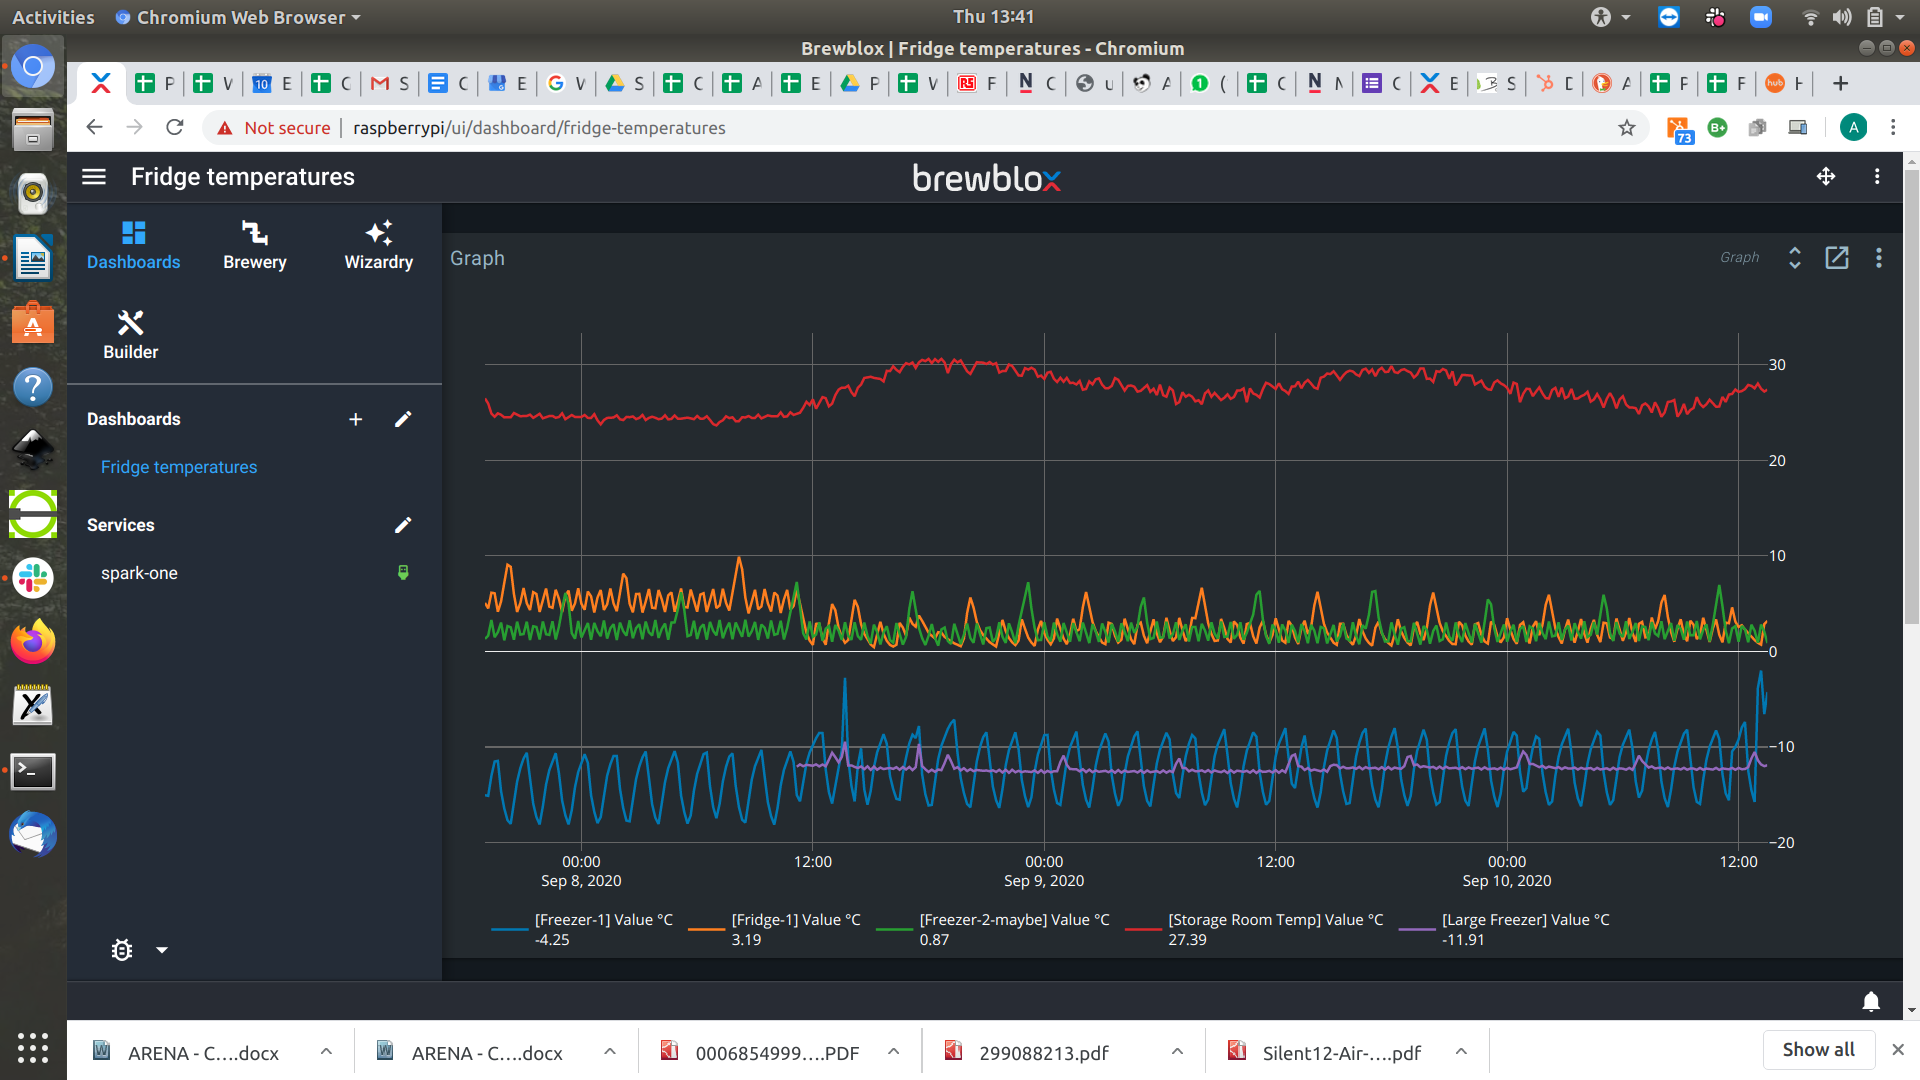
So I would like the graph to show 5 plots of temperature.
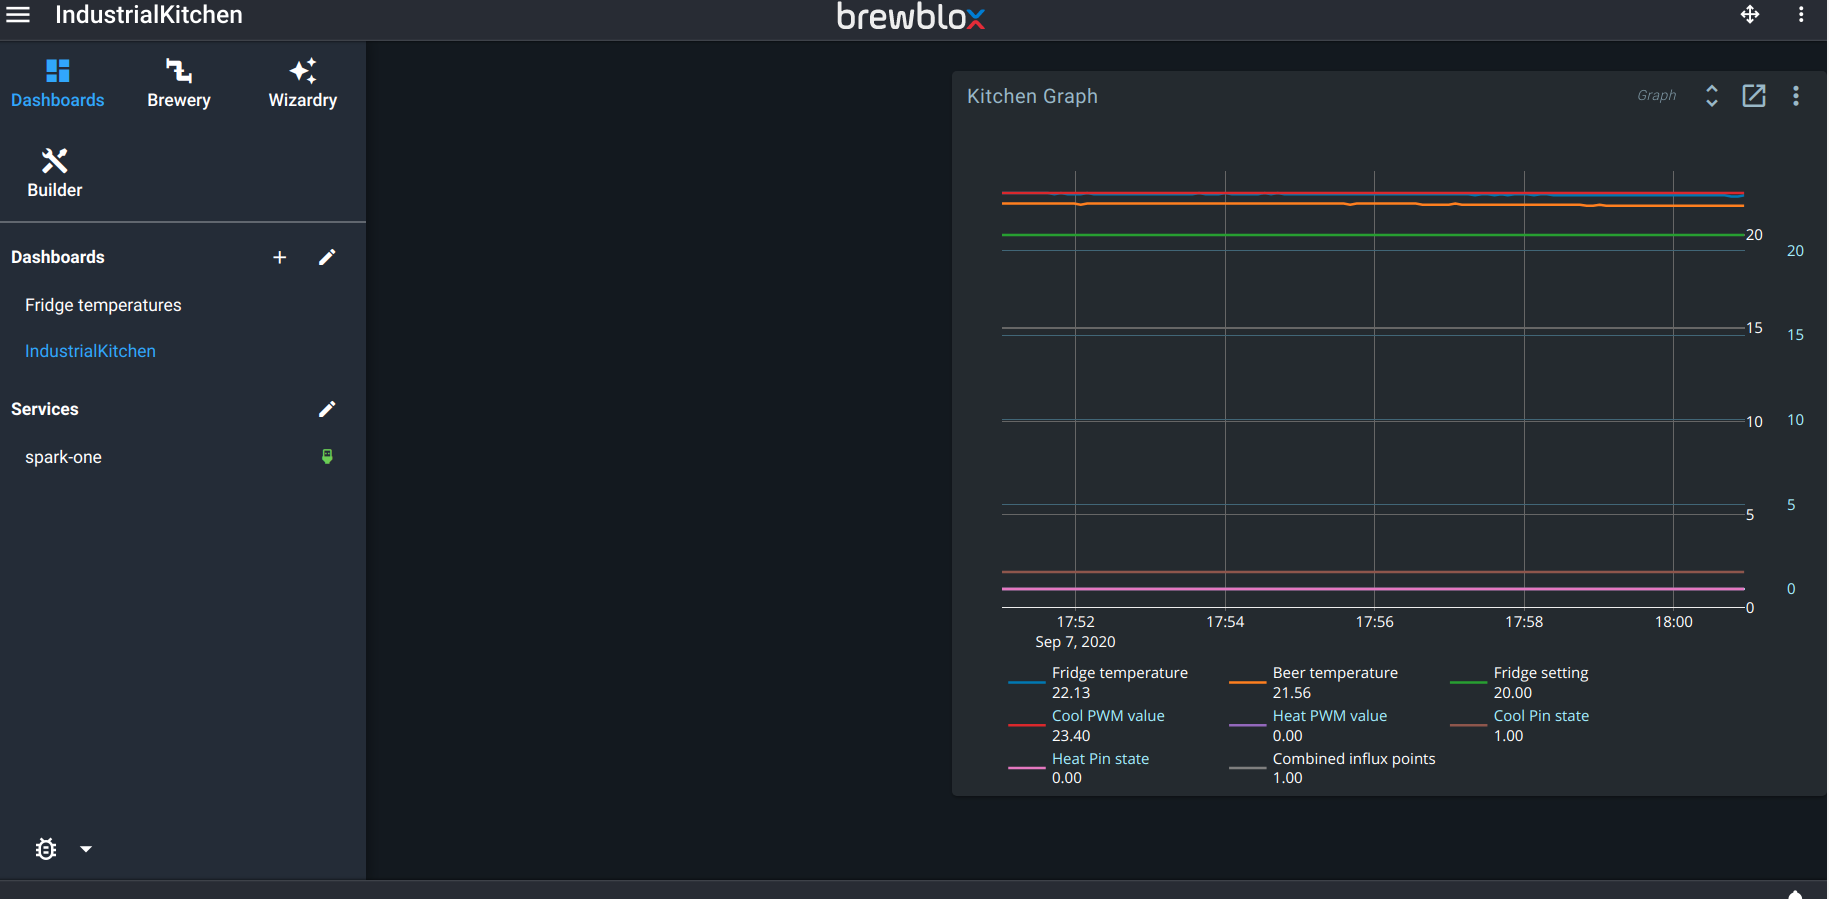
I made the mistake of doing the wizard for a brew and it is now labeled as beer this and that. I have tried going into settings to change things. The range does not seem to be correct even though it seems to be on autofit. I deleted redundant widgets but now I have a gap.
Before that I tried simply adding a widget to the dashboard called graph but I could not see the temperature sensors listed under the spark to be able to plot it.
Your graph also has other values now that impact the autorange.
The simplest way to reset everything is to delete the dashboards/graph widgets, and then go the Spark service page and remove all blocks.
You can do the latter in the actions menu in the top right of the service page.
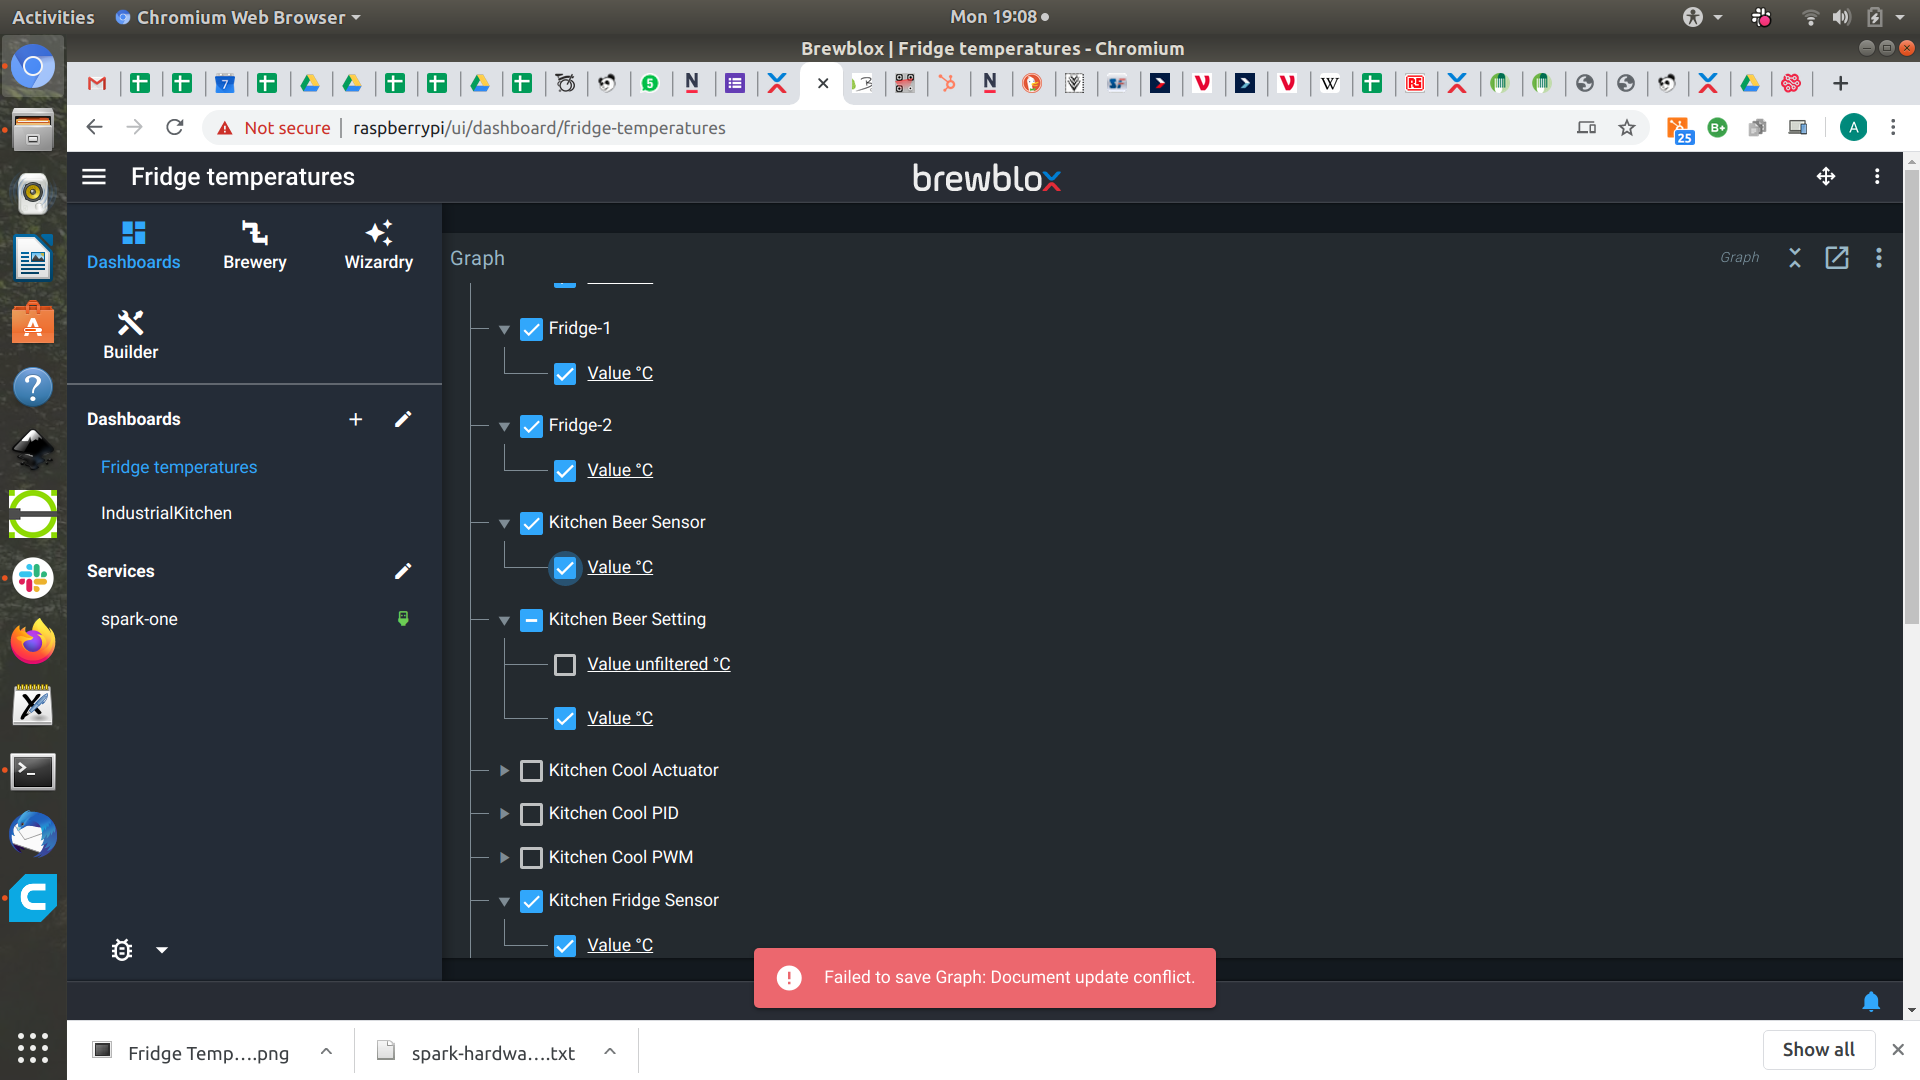
After removing all blocks, use the Discover Onewire Blocks action in the service page menu. You’ll see all your sensors reappear.
If you click on the actions menu for each sensor block, you can rename the block.
When your sensors have the desired names, create a new dashboard and place a graph widget on it.
The new sensor names will show up in its configuration.
The old sensor names will disappear from the graph settings in 24h: we don’t rename history data when the block name changes.
On the Spark one. Display settings, is there a possibility to plot a small graph instead of giving me the latest temperature reading? A spark line, nothing that would need too much resolution.
The constraint here is not resolution, but memory. The Spark has very little RAM/disk space, and graphs would need to store 2-5 blocks worth of data each.
How many temperature plots can I have? I realise that they can’t all be shown in the Spark. But how many thermocouples can i have connected to the same spark and plotted on the Web UI?