Hi there, I installed the Tilt and receive data in Brewblox when the Tilt is floating. When adding the Tilt data to the dashboard I get correct figures for °P and °C. However I see no checkbox to include the data into a graph on the dashboard. What is missing or went wrong during installation? Any way to fix this?
THX!
Patrick
You can open the settings for a graph widget, and add the tilt fields there. I’ll make a note to add the convenience “add to graph” function to tilt widgets.
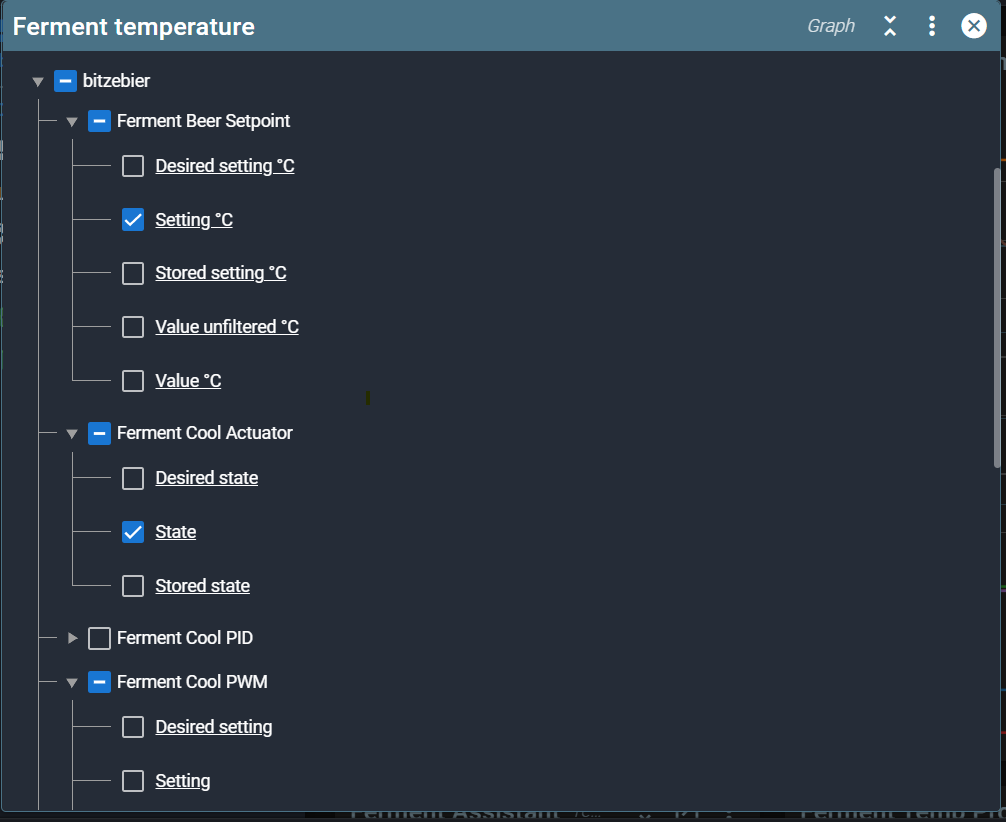
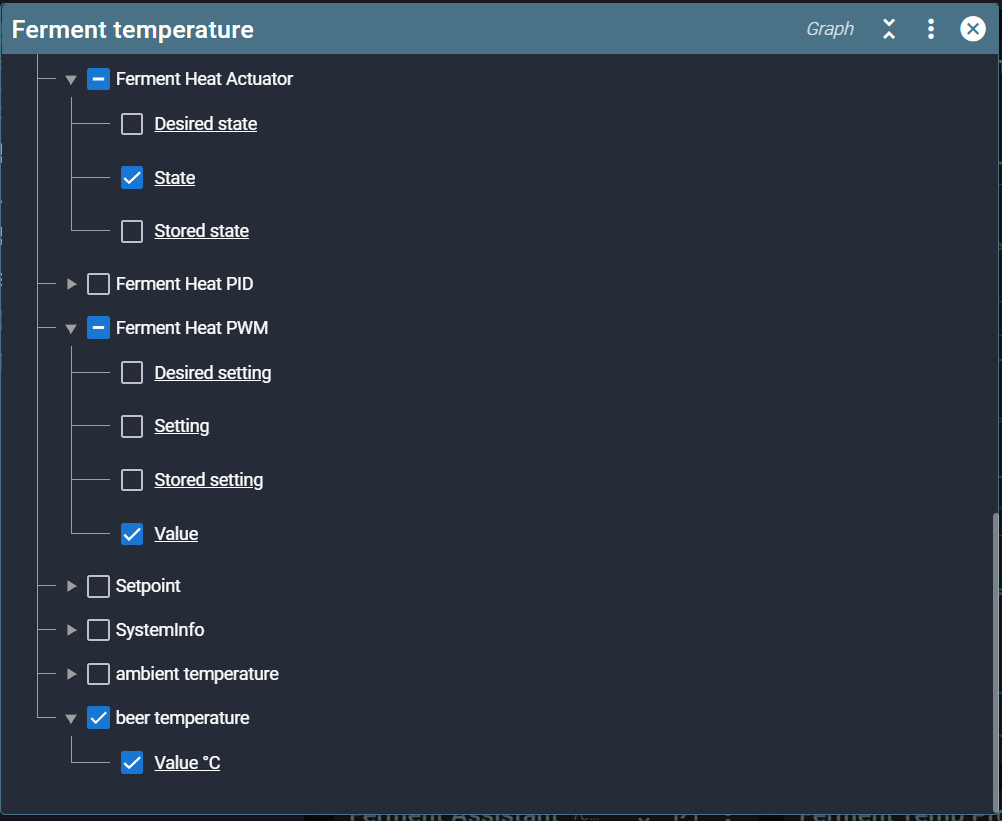
Thanks Bob. The Tilt fields are missing in the settings for the graph widget. Only temperature related fields that I can chose from. (sensors, setpoints, PID, PWM)
Ah, then I misunderstood. Some graph fields temporarily not showing up is a known issue, and one we’re working to resolve.
A workaround is to switch between graph durations. Fields may appear if you select 1h/1d/30d graph durations. They also spontaneously reappear after a while.
From what we can tell, the data is there, but there’s a bug while fetching it.
1 Like
All right, let me chase the bug then ![]()
Thanks,
Patrick
Just FYI. Works perfectly. Changing the duration made all the difference. ![]()
it happened again, only this time changing the duration does not help ![]()
Have you updated recently? Some two releases back we introduced a workaround that should prevent you having to toggle durations.
In the tilt service page, is it receiving updates?
I receive Tilt data, it is only not available in the graph. I haven’t updated yet. Will try this later from home… where do I find the updates? GitHub?
To update, run brewblox-ctl update, and reload the UI when it’s done.
1 Like