Unable to select graph parameters to view after update 2020-01-17

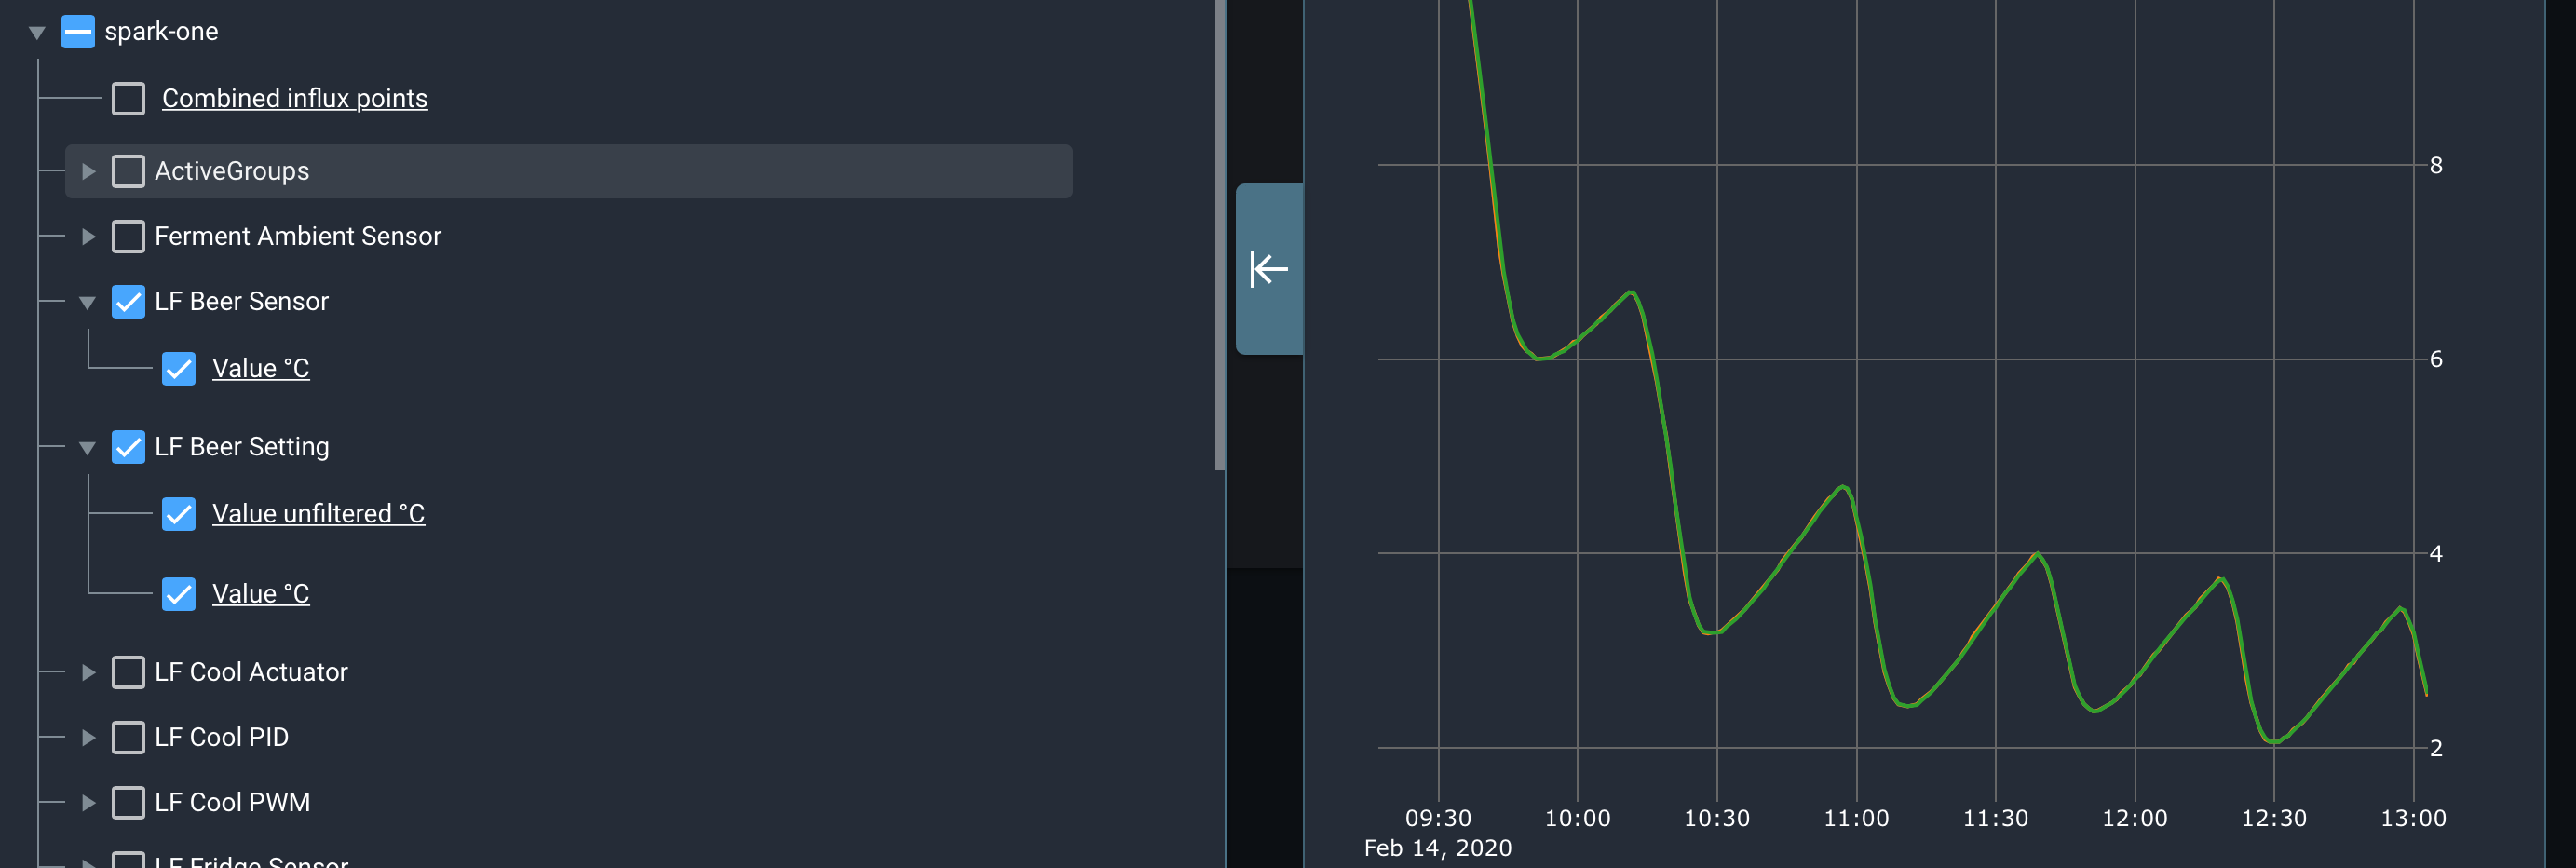
I have done a fresh install (2020-02-12) (firmware 2020-01-17) and run the Fermentation Fridge Wizard. This works all the way. Fine. However, when changing paramters to view in the frementation graph ALL paramters are “de-check” and it is NOT possible to select a singel value from the “spark-one” service.
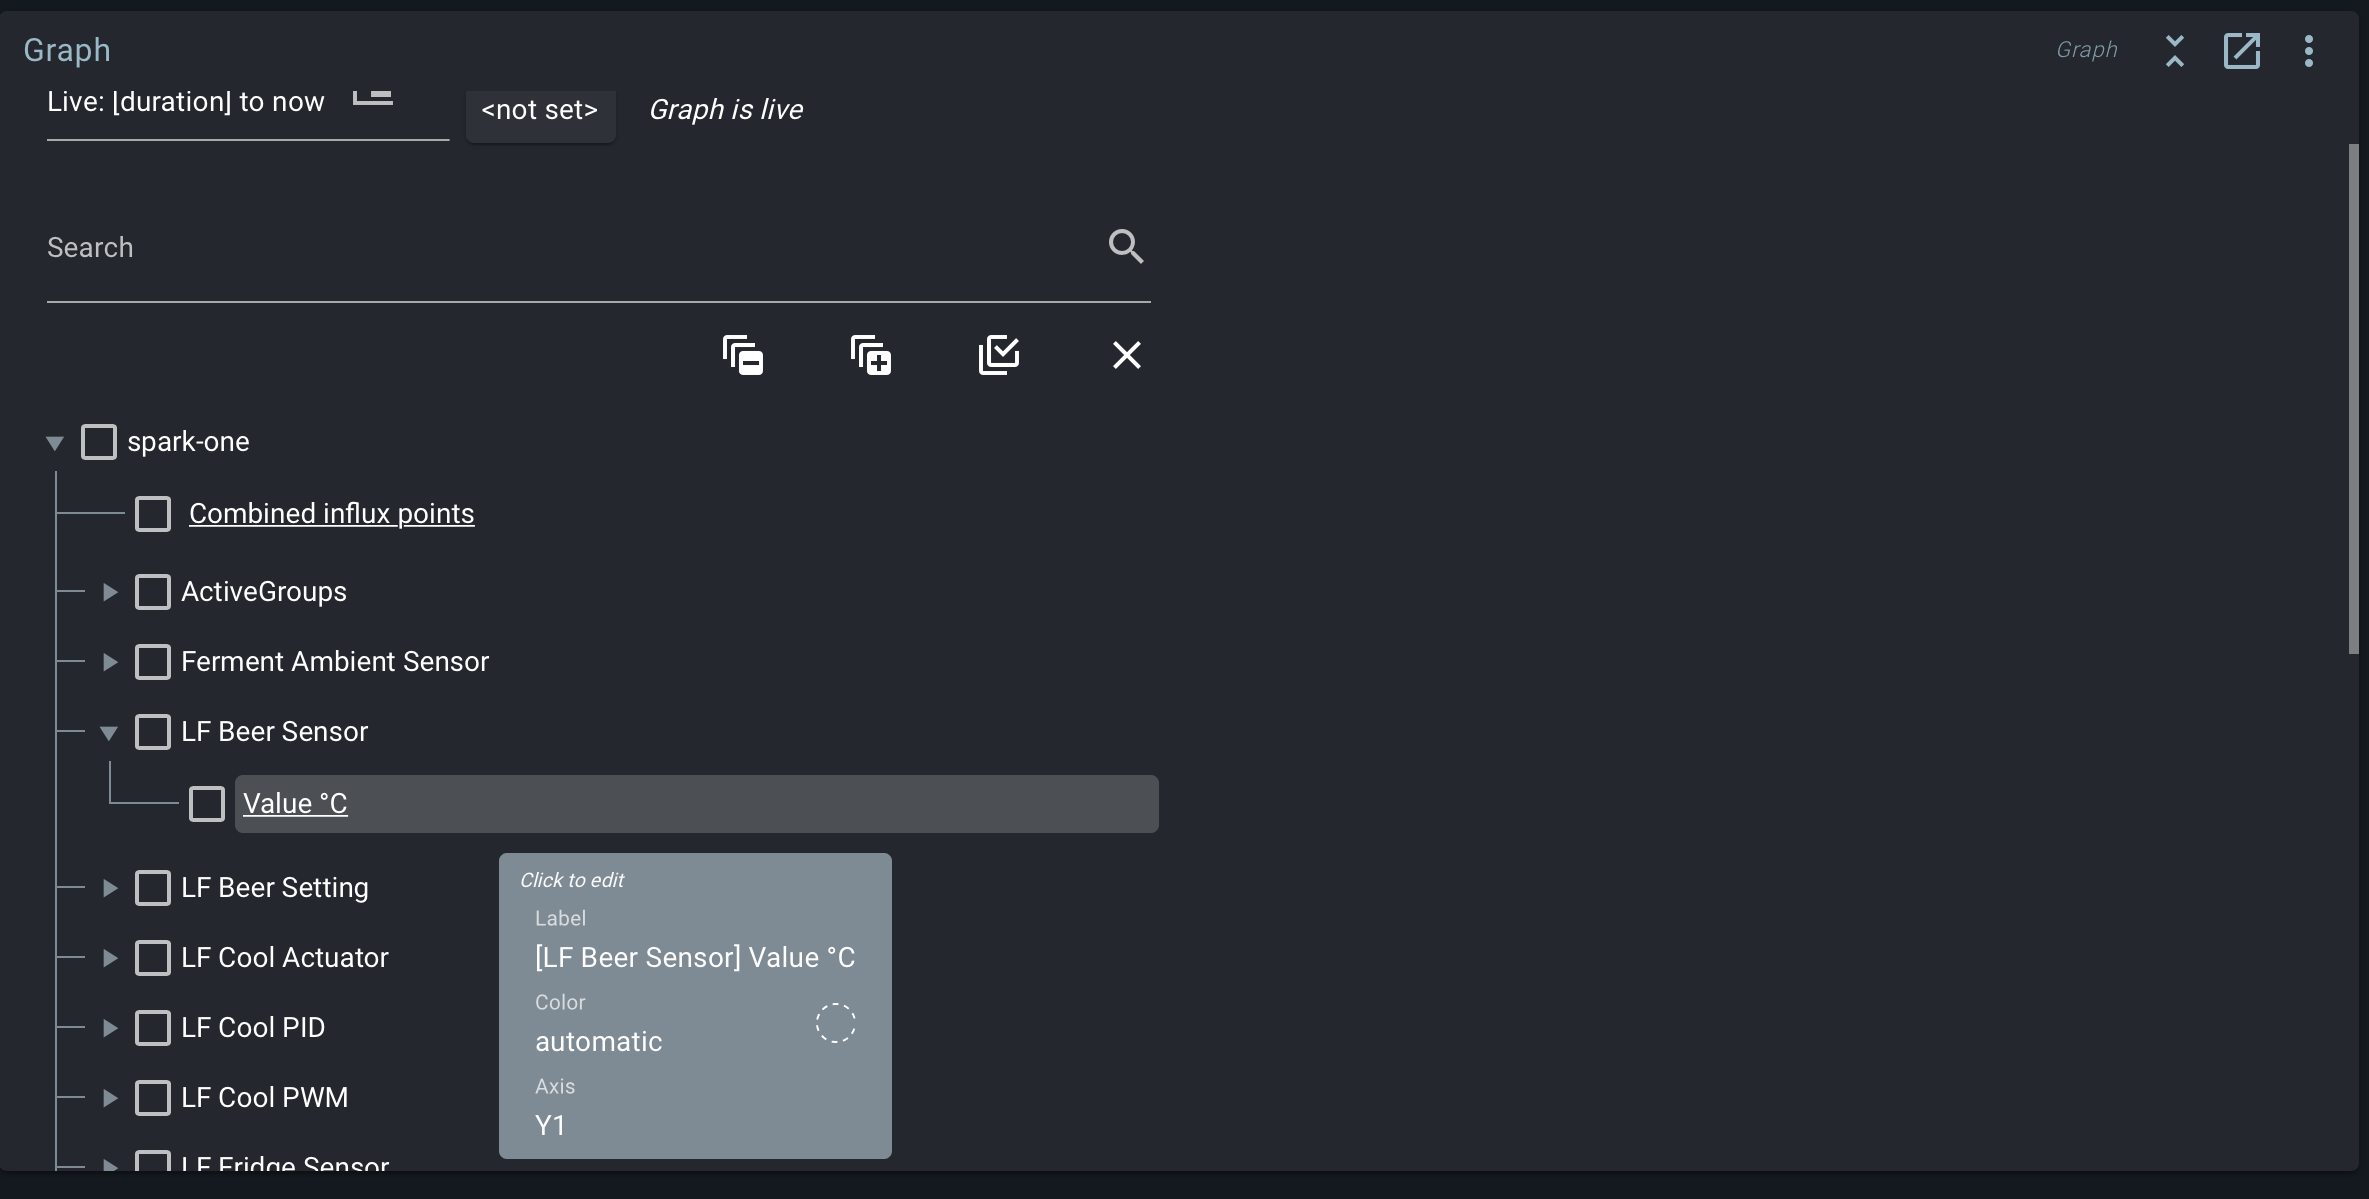
Making a “New Widget” - Graph in a new dashbord does NOT enable selecting any parameters from the “service”.
Graph_no_select|690x349

I have done clean installs on two brewpi systems with separate rpi´s - same issue.
Any suggestions?

In the bottom right, if you click the bell icon, does it show any errors?

If you open the dev console (ctrl + shift + i), and click on a graph setting, does it log an error?

@Bob_Steers, the bell report “no errors” in Firefox (OSX)
Not really shure wherer to search for error messages in the “dev console”.


Atle

Managed to reproduce the issue here. Will release a fix shortly.
Thanks for letting us know!

“[fantastic>”
Thanks.
Atle

Fix is released - the problem turned out to be relatively simple.

Run brewblox-ctl update --no-update-ctl --no-migrate --no-prune to update only the UI.

Success
Brewday saver!

Atle

1 Like

Hi Bob,

I ran the command above as well, because my graph was not working either.
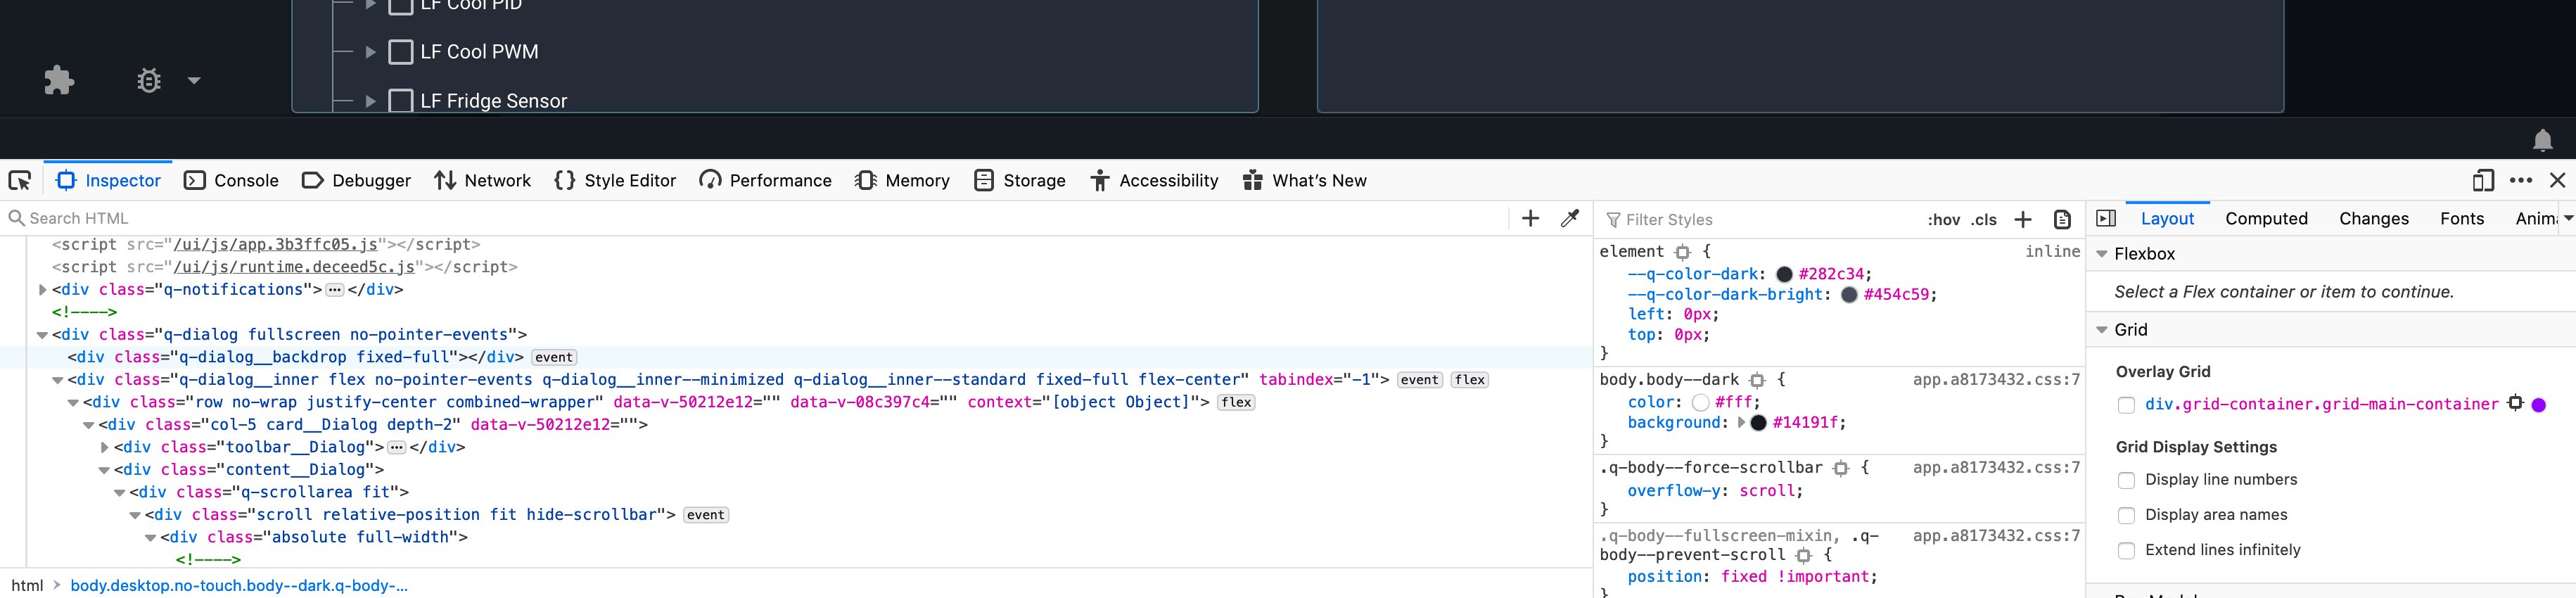
Somehow Brewblox didn’t finish installation and now I can’t reach Brewblox… When I try to ssh the Pi I get this:

“Host is down” is says…

Can you please help?

Troubleshooting steps for that would be (in order):

  • Check status led in pi (red (power) should be on, green (disk activity) blink intermittently).
  • Power cycle the Pi (unplug/plug adapter).
  • Check whether it got a new IP address (the fing android app works great for this).
  • Attach a monitor, and check whether it boots ok. You need to restart the pi after attaching the monitor.

Edit: fixed colors of Pi status leds.

I thought green was the activity LED and red the power LED.

Thanks Bob and Elco; seems to work as a charm again!