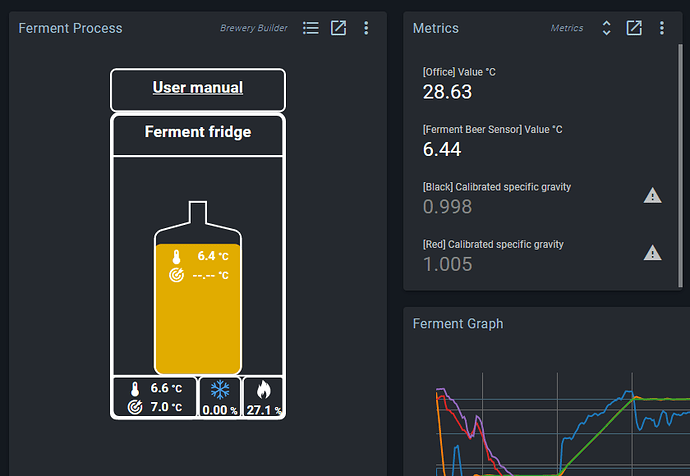
Does the metric widget display values?
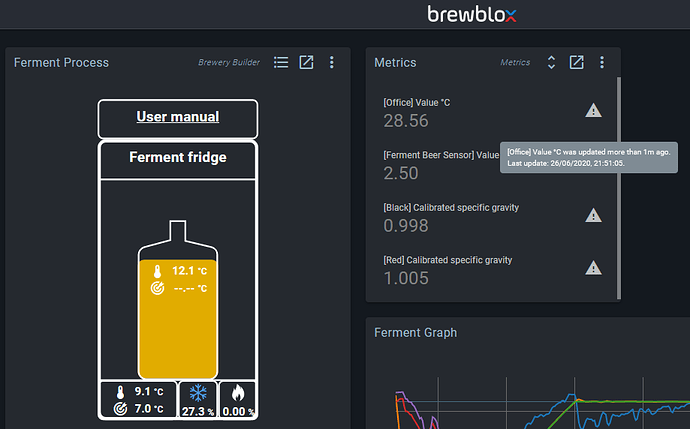
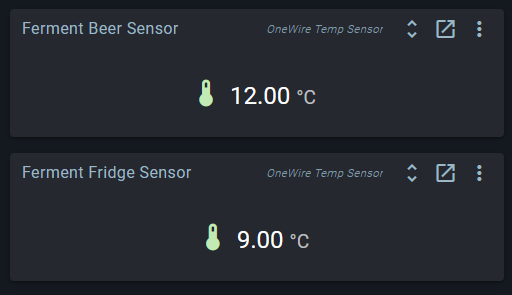
In its settings you can configure the duration before the value is considered stale. Is this value set to something sensible? The Spark update rate is every 5s. Tilts are more infrequent.
Sorry, I meant to put a picture in to show what I mean…
So this shows that the most recent update was about 90 minutes ago (when I ran the update).
Do you have any errors in your web console / network tab? Could you please run brewblox-ctl log?
If I look at the sensors in the Spark Controller page, then they look correct:
Yes, I see the following errors in the Network tab of console:
The connection to [https://192.168.169.20/history/sse/values?epoch=ms&fields=Fe…park-one&start=Sat%2C%2013%20Jun%202020%2017%3A00%3A00%20GMT](https://192.168.169.20/history/sse/values?epoch=ms&fields=Ferment%20Fridge%20Sensor%2Fvalue%5BdegC%5D&fields=Ferment%20Beer%20Sensor%2Fvalue%5BdegC%5D&fields=Ferment%20Beer%20Setting%2Fsetting%5BdegC%5D&measurement=spark-one&start=Sat%2C%2013%20Jun%202020%2017%3A00%3A00%20GMT) was interrupted while the page was loading. [app.cb16e105.js:1:534495](https://192.168.169.20/ui/js/app.cb16e105.js)

The connection to [https://192.168.169.20/history/sse/last_values?epoch=ms&fiel…ields=Red%2FCalibrated%20specific%20gravity&measurement=tilt](https://192.168.169.20/history/sse/last_values?epoch=ms&fields=Black%2FCalibrated%20specific%20gravity&fields=Red%2FCalibrated%20specific%20gravity&measurement=tilt) was interrupted while the page was loading. [app.cb16e105.js:1:534495](https://192.168.169.20/ui/js/app.cb16e105.js)

The connection to [https://192.168.169.20/history/sse/values?duration=7d&epoch=…BdegC%5D&fields=Red%2FTemperature%5BdegC%5D&measurement=tilt](https://192.168.169.20/history/sse/values?duration=7d&epoch=ms&fields=Black%2FSpecific%20gravity&fields=Red%2FSpecific%20gravity&fields=Black%2FTemperature%5BdegC%5D&fields=Red%2FTemperature%5BdegC%5D&measurement=tilt) was interrupted while the page was loading. [app.cb16e105.js:1:534495](https://192.168.169.20/ui/js/app.cb16e105.js)

The connection to [https://192.168.169.20/history/sse/values?epoch=ms&fields=Bl…ent=tilt&start=Sat%2C%2013%20Jun%202020%2017%3A00%3A00%20GMT](https://192.168.169.20/history/sse/values?epoch=ms&fields=Black%2FCalibrated%20specific%20gravity&fields=Red%2FCalibrated%20specific%20gravity&measurement=tilt&start=Sat%2C%2013%20Jun%202020%2017%3A00%3A00%20GMT) was interrupted while the page was loading. [app.cb16e105.js:1:534495](https://192.168.169.20/ui/js/app.cb16e105.js)

The connection to [https://192.168.169.20/history/sse/last_values?epoch=ms&fiel…ment%20Beer%20Sensor%2Fvalue%5BdegC%5D&measurement=spark-one](https://192.168.169.20/history/sse/last_values?epoch=ms&fields=Office%2Fvalue%5BdegC%5D&fields=Ferment%20Beer%20Sensor%2Fvalue%5BdegC%5D&measurement=spark-one) was interrupted while the page was loading. [app.cb16e105.js:1:534495](https://192.168.169.20/ui/js/app.cb16e105.js)

Firefox can't establish a connection to the server at wss://192.168.169.20/eventbus. [vendor.78693420.js:43:147636](https://192.168.169.20/ui/js/vendor.78693420.js)
Logs are at: https://termbin.com/t07r
I have tried on another computer and still get the same issue.
The backend looks fine, so it appears to be some problem between the Pi and your client.
Could you please go to the network tab in your browser dev tools, reload the page, right click, and select “save all as HAR”?
Here you go:
192.168.169.20_Archive [20-06-26 23-58-07].zip (1009.4 KB)
I had to compress as too large to upload.
(Interestingly, the website will not let me upload a 7z file, only zip) 
7z is allowed now. There’s a list in the admin panel somewhere. It’s a bit silly if you ask me, given how easy it is to change an extension, but that’s how discourse works.
Going by network stats, everything is working.
You can try to directly load the event stream in a chrome-like browser:
- go to your network tab
- rmb on the last_values entry, and copy the URL
- open the browser (doesn’t work in firefox, haven’t tested in safari)
- paste the url. You should see a raw JSON data stream.
The URL should look something like
https://washberry.local/history/sse/last_values?epoch=ms&fields=Catty%2Fvalue%5BdegC%5D&measurement=spark-one
Hello Bob,
Luckily I found that I still have a VM with Chrome on - I gave up on it a while ago due to its resource hungriness, and it not playing well with some of the tools we use at work.
I did what you suggested, the output is below:
data: [{"field": "Office/value[degC]", "time": 1593204665761, "value": 28.5625}]

data: [{"field": "Office/value[degC]", "time": 1593204665761, "value": 28.5625}]

data: [{"field": "Office/value[degC]", "time": 1593204665761, "value": 28.5625}]

: ping

data: [{"field": "Office/value[degC]", "time": 1593204665761, "value": 28.5625}]

data: [{"field": "Office/value[degC]", "time": 1593204665761, "value": 28.5625}]

data: [{"field": "Office/value[degC]", "time": 1593204665761, "value": 28.5625}]

: ping

data: [{"field": "Office/value[degC]", "time": 1593204665761, "value": 28.5625}]

data: [{"field": "Office/value[degC]", "time": 1593204665761, "value": 28.5625}]

data: [{"field": "Office/value[degC]", "time": 1593204665761, "value": 28.5625}]

: ping

data: [{"field": "Office/value[degC]", "time": 1593204665761, "value": 28.5625}]

data: [{"field": "Office/value[degC]", "time": 1593204665761, "value": 28.5625}]

data: [{"field": "Office/value[degC]", "time": 1593204665761, "value": 28.5625}]

: ping

data: [{"field": "Office/value[degC]", "time": 1593204665761, "value": 28.5625}]

data: [{"field": "Office/value[degC]", "time": 1593204665761, "value": 28.5625}]

data: [{"field": "Office/value[degC]", "time": 1593204665761, "value": 28.5625}]

: ping

data: [{"field": "Office/value[degC]", "time": 1593204665761, "value": 28.5625}]
So, unless I am reading this wrong, this looks to be just repeating the same output - the temperature is not wavering even in the slightest and the time appears to be the same.
Similar for another page in the UI:
data: [{"field": "Office/value[degC]", "time": 1593204665761, "value": 28.5625}, {"field": "Ferment Beer Sensor/value[degC]", "time": 1593204665761, "value": 2.5}]
data: [{"field": "Office/value[degC]", "time": 1593204665761, "value": 28.5625}, {"field": "Ferment Beer Sensor/value[degC]", "time": 1593204665761, "value": 2.5}]
data: [{"field": "Office/value[degC]", "time": 1593204665761, "value": 28.5625}, {"field": "Ferment Beer Sensor/value[degC]", "time": 1593204665761, "value": 2.5}]
: ping
data: [{"field": "Office/value[degC]", "time": 1593204665761, "value": 28.5625}, {"field": "Ferment Beer Sensor/value[degC]", "time": 1593204665761, "value": 2.5}]
data: [{"field": "Office/value[degC]", "time": 1593204665761, "value": 28.5625}, {"field": "Ferment Beer Sensor/value[degC]", "time": 1593204665761, "value": 2.5}]
data: [{"field": "Office/value[degC]", "time": 1593204665761, "value": 28.5625}, {"field": "Ferment Beer Sensor/value[degC]", "time": 1593204665761, "value": 2.5}]
: ping
Anyway, I will have to check back tomorrow, so no rush for a response!
Repeated queries yielding the same point suggests no new data is being published.
You may want to try restarting your services (brewblox-ctl restart).
IPv6 in containers is a common cause of network reset errors. If you haven’t done so already, you can run brewblox-ctl disable-ipv6).
To trace published messages, you can add the debug flag to the history service. In your docker-compose.yml, add the following under services:
  history:
    command: --debug
Then run brewblox-ctl up to apply, and brewblox-ctl follow history to subscribe to logs.
Hello Bob,
Thanks for the reply. I tried all of that, still not updating. Follow history gives me:
history_1    | 2020/06/27 12:22:09 DEBUG    aioinflux                       200: SELECT last("Office/value[degC]") FROM "brewblox"."autogen"."spark-one" WHERE time > now() - 30d;SELECT last("Ferment Beer Sensor/value[degC]") FROM "brewblox"."autogen"."spark-one" WHERE time > now() - 30d
history_1    | 2020/06/27 12:22:09 DEBUG    aioinflux                       200: SELECT last("Black/Calibrated specific gravity") FROM "brewblox"."autogen"."tilt" WHERE time > now() - 30d;SELECT last("Red/Calibrated specific gravity") FROM "brewblox"."autogen"."tilt" WHERE time > now() - 30d
history_1    | 2020/06/27 12:22:09 DEBUG    aioinflux                       200: SELECT "m_m_m_Black/Calibrated specific gravity","m_m_m_Red/Calibrated specific gravity" FROM "brewblox"."downsample_1h"."tilt" WHERE time >= 1593198000001000000
history_1    | 2020/06/27 12:22:09 DEBUG    aioinflux                       200: SELECT "m_m_m_Ferment Fridge Sensor/value[degC]","m_m_m_Ferment Beer Sensor/value[degC]","m_m_m_Ferment Beer Setting/setting[degC]" FROM "brewblox"."downsample_1h"."spark-one" WHERE time >= 1593198000001000000
history_1    | 2020/06/27 12:22:10 DEBUG    aioinflux                       200: SELECT "m_m_Black/Specific gravity","m_m_Red/Specific gravity","m_m_Black/Temperature[degC]","m_m_Red/Temperature[degC]" FROM "brewblox"."downsample_10m"."tilt" WHERE time >= 1593202800001000000
history_1    | 2020/06/27 12:22:10 DEBUG    aioinflux                       204: No Content
history_1    | 2020/06/27 12:22:14 DEBUG    aioinflux                       200: SELECT last("Office/value[degC]") FROM "brewblox"."autogen"."spark-one" WHERE time > now() - 30d;SELECT last("Ferment Beer Sensor/value[degC]") FROM "brewblox"."autogen"."spark-one" WHERE time > now() - 30d
history_1    | 2020/06/27 12:22:14 DEBUG    aioinflux                       200: SELECT last("Black/Calibrated specific gravity") FROM "brewblox"."autogen"."tilt" WHERE time > now() - 30d;SELECT last("Red/Calibrated specific gravity") FROM "brewblox"."autogen"."tilt" WHERE time > now() - 30d
history_1    | 2020/06/27 12:22:14 DEBUG    aioinflux                       200: SELECT "m_m_m_Black/Calibrated specific gravity","m_m_m_Red/Calibrated specific gravity" FROM "brewblox"."downsample_1h"."tilt" WHERE time >= 1593198000001000000
history_1    | 2020/06/27 12:22:14 DEBUG    aioinflux                       200: SELECT "m_m_m_Ferment Fridge Sensor/value[degC]","m_m_m_Ferment Beer Sensor/value[degC]","m_m_m_Ferment Beer Setting/setting[degC]" FROM "brewblox"."downsample_1h"."spark-one" WHERE time >= 1593198000001000000
history_1    | 2020/06/27 12:22:15 DEBUG    aioinflux                       200: SELECT "m_m_Black/Specific gravity","m_m_Red/Specific gravity","m_m_Black/Temperature[degC]","m_m_Red/Temperature[degC]" FROM "brewblox"."downsample_10m"."tilt" WHERE time >= 1593202800001000000
history_1    | 2020/06/27 12:22:15 DEBUG    aioinflux                       204: No Content
history_1    | 2020/06/27 12:22:19 DEBUG    aioinflux                       200: SELECT last("Office/value[degC]") FROM "brewblox"."autogen"."spark-one" WHERE time > now() - 30d;SELECT last("Ferment Beer Sensor/value[degC]") FROM "brewblox"."autogen"."spark-one" WHERE time > now() - 30d
history_1    | 2020/06/27 12:22:19 DEBUG    aioinflux                       200: SELECT last("Black/Calibrated specific gravity") FROM "brewblox"."autogen"."tilt" WHERE time > now() - 30d;SELECT last("Red/Calibrated specific gravity") FROM "brewblox"."autogen"."tilt" WHERE time > now() - 30d
history_1    | 2020/06/27 12:22:19 DEBUG    aioinflux                       200: SELECT "m_m_m_Black/Calibrated specific gravity","m_m_m_Red/Calibrated specific gravity" FROM "brewblox"."downsample_1h"."tilt" WHERE time >= 1593198000001000000
history_1    | 2020/06/27 12:22:19 DEBUG    aioinflux                       200: SELECT "m_m_m_Ferment Fridge Sensor/value[degC]","m_m_m_Ferment Beer Sensor/value[degC]","m_m_m_Ferment Beer Setting/setting[degC]" FROM "brewblox"."downsample_1h"."spark-one" WHERE time >= 1593198000001000000
history_1    | 2020/06/27 12:22:20 DEBUG    aioinflux                       200: SELECT "m_m_Black/Specific gravity","m_m_Red/Specific gravity","m_m_Black/Temperature[degC]","m_m_Red/Temperature[degC]" FROM "brewblox"."downsample_10m"."tilt" WHERE time >= 1593202800001000000
history_1    | 2020/06/27 12:22:20 DEBUG    aioinflux                       204: No Content
history_1    | 2020/06/27 12:22:24 DEBUG    aioinflux                       200: SELECT last("Office/value[degC]") FROM "brewblox"."autogen"."spark-one" WHERE time > now() - 30d;SELECT last("Ferment Beer Sensor/value[degC]") FROM "brewblox"."autogen"."spark-one" WHERE time > now() - 30d
history_1    | 2020/06/27 12:22:24 DEBUG    aioinflux                       200: SELECT last("Black/Calibrated specific gravity") FROM "brewblox"."autogen"."tilt" WHERE time > now() - 30d;SELECT last("Red/Calibrated specific gravity") FROM "brewblox"."autogen"."tilt" WHERE time > now() - 30d
history_1    | 2020/06/27 12:22:24 DEBUG    aioinflux                       200: SELECT "m_m_m_Black/Calibrated specific gravity","m_m_m_Red/Calibrated specific gravity" FROM "brewblox"."downsample_1h"."tilt" WHERE time >= 1593198000001000000
history_1    | 2020/06/27 12:22:24 DEBUG    aioinflux                       200: SELECT "m_m_m_Ferment Fridge Sensor/value[degC]","m_m_m_Ferment Beer Sensor/value[degC]","m_m_m_Ferment Beer Setting/setting[degC]" FROM "brewblox"."downsample_1h"."spark-one" WHERE time >= 1593198000001000000
history_1    | 2020/06/27 12:22:25 DEBUG    aioinflux                       200: SELECT "m_m_Black/Specific gravity","m_m_Red/Specific gravity","m_m_Black/Temperature[degC]","m_m_Red/Temperature[degC]" FROM "brewblox"."downsample_10m"."tilt" WHERE time >= 1593202800001000000
history_1    | 2020/06/27 12:22:25 DEBUG    aioinflux                       204: No Content
history_1    | 2020/06/27 12:22:29 DEBUG    aioinflux                       200: SELECT last("Office/value[degC]") FROM "brewblox"."autogen"."spark-one" WHERE time > now() - 30d;SELECT last("Ferment Beer Sensor/value[degC]") FROM "brewblox"."autogen"."spark-one" WHERE time > now() - 30d
history_1    | 2020/06/27 12:22:29 DEBUG    aioinflux                       200: SELECT last("Black/Calibrated specific gravity") FROM "brewblox"."autogen"."tilt" WHERE time > now() - 30d;SELECT last("Red/Calibrated specific gravity") FROM "brewblox"."autogen"."tilt" WHERE time > now() - 30d
history_1    | 2020/06/27 12:22:29 DEBUG    aioinflux                       200: SELECT "m_m_m_Black/Calibrated specific gravity","m_m_m_Red/Calibrated specific gravity" FROM "brewblox"."downsample_1h"."tilt" WHERE time >= 1593198000001000000
history_1    | 2020/06/27 12:22:29 DEBUG    aioinflux                       200: SELECT "m_m_m_Ferment Fridge Sensor/value[degC]","m_m_m_Ferment Beer Sensor/value[degC]","m_m_m_Ferment Beer Setting/setting[degC]" FROM "brewblox"."downsample_1h"."spark-one" WHERE time >= 1593198000001000000
history_1    | 2020/06/27 12:22:30 DEBUG    aioinflux                       200: SELECT "m_m_Black/Specific gravity","m_m_Red/Specific gravity","m_m_Black/Temperature[degC]","m_m_Red/Temperature[degC]" FROM "brewblox"."downsample_10m"."tilt" WHERE time >= 1593202800001000000
history_1    | 2020/06/27 12:22:30 DEBUG    aioinflux                       204: No Content
history_1    | 2020/06/27 12:22:34 DEBUG    aioinflux                       200: SELECT last("Office/value[degC]") FROM "brewblox"."autogen"."spark-one" WHERE time > now() - 30d;SELECT last("Ferment Beer Sensor/value[degC]") FROM "brewblox"."autogen"."spark-one" WHERE time > now() - 30d
history_1    | 2020/06/27 12:22:34 DEBUG    aioinflux                       200: SELECT last("Black/Calibrated specific gravity") FROM "brewblox"."autogen"."tilt" WHERE time > now() - 30d;SELECT last("Red/Calibrated specific gravity") FROM "brewblox"."autogen"."tilt" WHERE time > now() - 30d
history_1    | 2020/06/27 12:22:34 DEBUG    aioinflux                       200: SELECT "m_m_m_Black/Calibrated specific gravity","m_m_m_Red/Calibrated specific gravity" FROM "brewblox"."downsample_1h"."tilt" WHERE time >= 1593198000001000000
history_1    | 2020/06/27 12:22:34 DEBUG    aioinflux                       200: SELECT "m_m_m_Ferment Fridge Sensor/value[degC]","m_m_m_Ferment Beer Sensor/value[degC]","m_m_m_Ferment Beer Setting/setting[degC]" FROM "brewblox"."downsample_1h"."spark-one" WHERE time >= 1593198000001000000
history_1    | 2020/06/27 12:22:35 DEBUG    aioinflux                       200: SELECT "m_m_Black/Specific gravity","m_m_Red/Specific gravity","m_m_Black/Temperature[degC]","m_m_Red/Temperature[degC]" FROM "brewblox"."downsample_10m"."tilt" WHERE time >= 1593202800001000000
history_1    | 2020/06/27 12:22:35 DEBUG    aioinflux                       204: No Content
LOgs: https://termbin.com/4843
Ahhh, I think I get it. You overrode the eventbus service in docker-compose.yml by copying all its configuration, including the image.
The default rabbitMQ image does not have the MQTT protocol enabled. We add a config file to the RabbitMQ image, and then re-publish it as brewblox/rabbitmq. All services that now publish data using MQTT have been unable to connect.
The Tilt service was just updated as well, removing the need to expose the eventbus port. You can fix your config by running
brewblox-ctl service remove eventbus
docker-compose pull
brewblox-ctl up
I’ll also have a look at making eventbus connection errors slightly more prominent again - we mute all errors after the first to prevent spam during startup.
Um, OK. 
No idea what you mean, I am not aware of doing anything in docker-compose.yml - just ran the update as usual with brewblox-ctl update
Unless this was part of the modifications which had to be done some time ago to get the Tilt working in the earlier days.
Either way, I have done what you suggested, ran:
brewblox-ctl service remove -n eventbus
docker-compose pull
brewblox-ctl up
and now I am seeing stats updating for the temperatures!
The Tilts are out of range as just finished a brewday and they are in the fermentor which I have not put in the fridge yet.
Thanks for the help (again)!
Kind regards,
Jerry
Happy to hear it works again!
The compose changes indeed would’ve been made to set up the Tilt. It now caused a conflict due to changes on our end.
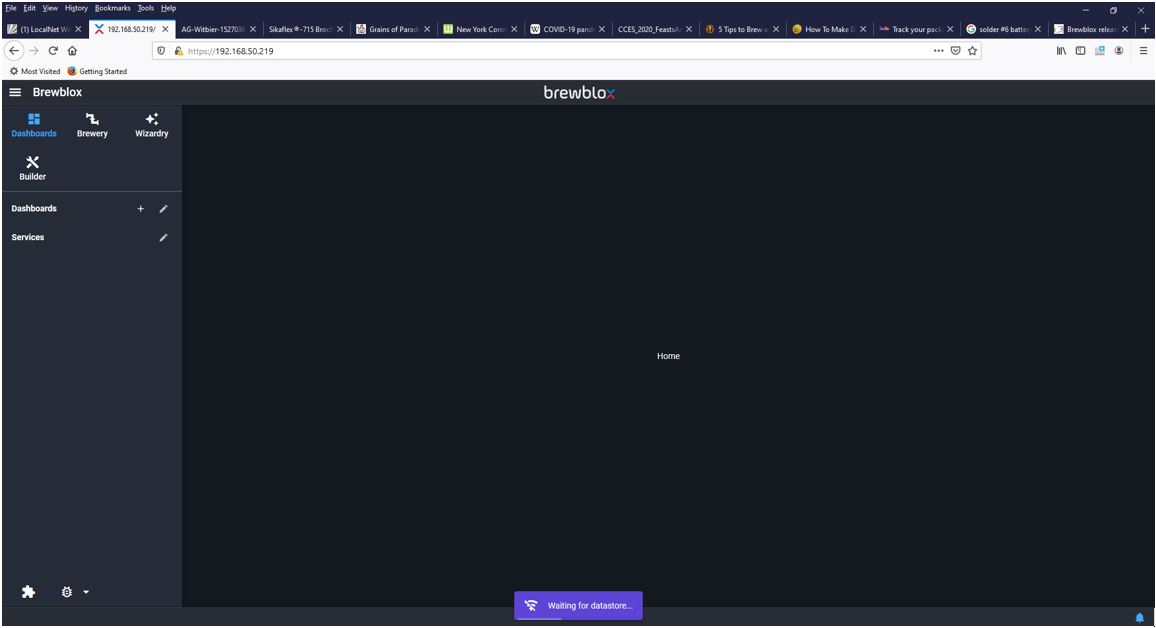
Bob, starting day 3 running a profile on my firmenter and tried to startup the UI and I have waiting on DataStore again… If I understand correctly, the profile is running in the Spark ??? The Pi Server just shows whats going on ???
That’s correct: Setpoint Profiles run on the controller itself.
If the datastore is often acting up on startup, you may want to check free space and age of your SD card. Repeated hangups are an indicator the kind of data corruption you get when a card is about to die.
At the very least, I’d recommend making a backup (brewblox-ctl backup save), and storing it on a different computer.
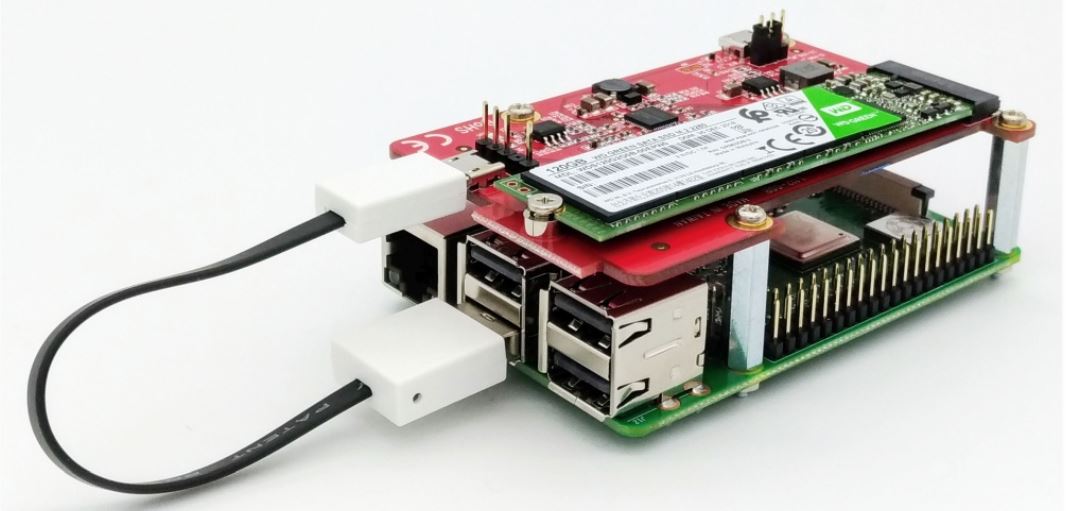
Ah, that does change matters. It’s still good to keep backups, but SSDs live longer, and generally don’t suffer from progressive r/w failures. One day they die, and that’s it.
You could try disabling the swap file on the Pi. We’ve been testing that for a while now, and it seems to have fixed some other weird memory-related crashes.
dphys-swapfile swapoff
dphys-swapfile uninstall
update-rc.d dphys-swapfile remove
rm -f /etc/init.d/dphys-swapfile

service dphys-swapfile stop
systemctl disable dphys-swapfile.service
sudo reboot
Do this in the BrewBlox directory ??
