For once, it actually doesn’t matter.
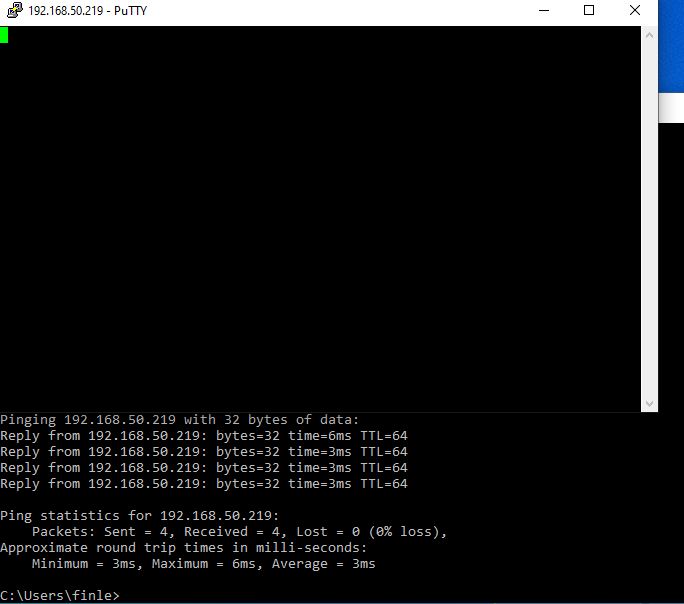
I guess I have something else going on… Using PuTTY to SSH in it just sets there. I can ping the Pi Server but that’s it. Connected a screen to it and it is just black.
Is this before or after you ran those swap file commands?
Any monitors must be connected before the Pi boots, otherwise they won’t be used.
If it doesn’t respond to SSH, it really looks like a swap memory issue.
I’d unplug the Pi, attach monitor, start the Pi, and run swap file commands.
After the reboot, start brewblox again.
When I issue ```
dphys-swapfile swapoff
I get back
swapoff: Not superuser
figured it out, running the commands now…
Looks to be back up and running !!! Time will tell, I guess…
Another piece of information is that it seems the Pi Server stopped collecting data right at midnight last night. Judging this from the data gap when I display 2 days worth of data.
1 Like
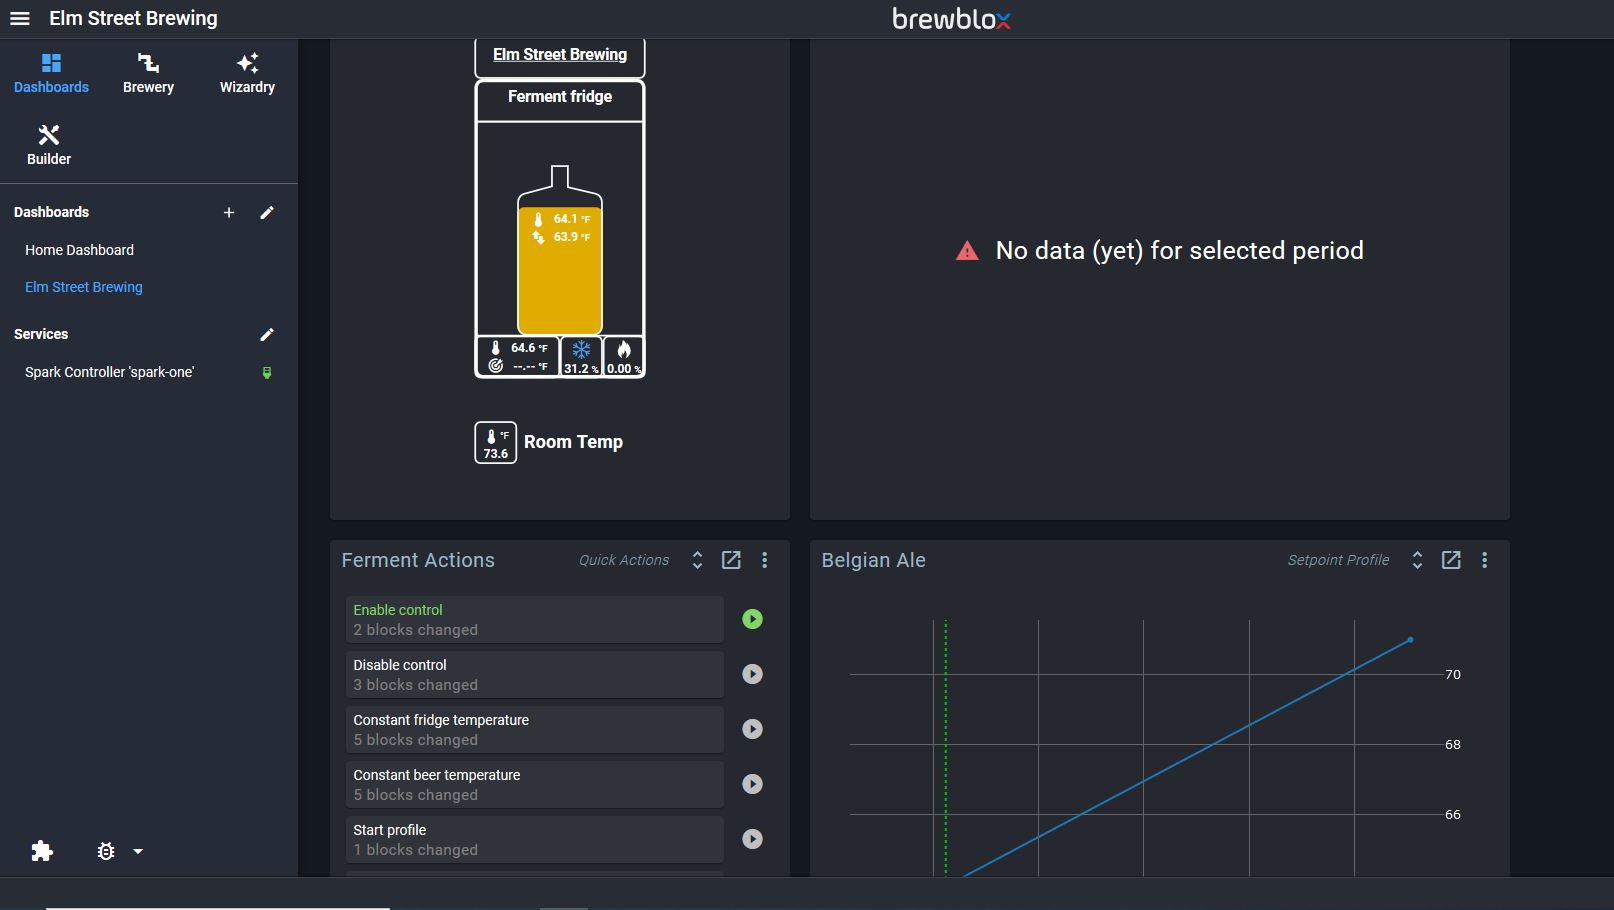
Not 100% sure it is this version related, but I regular have “No data (yet)” errors as well. I already upgraded my power, turned off swap, bought a new SD a month or 3 ago and put heatsinks on my Rpi 3, but is still hangs a lot and regular show theses errors
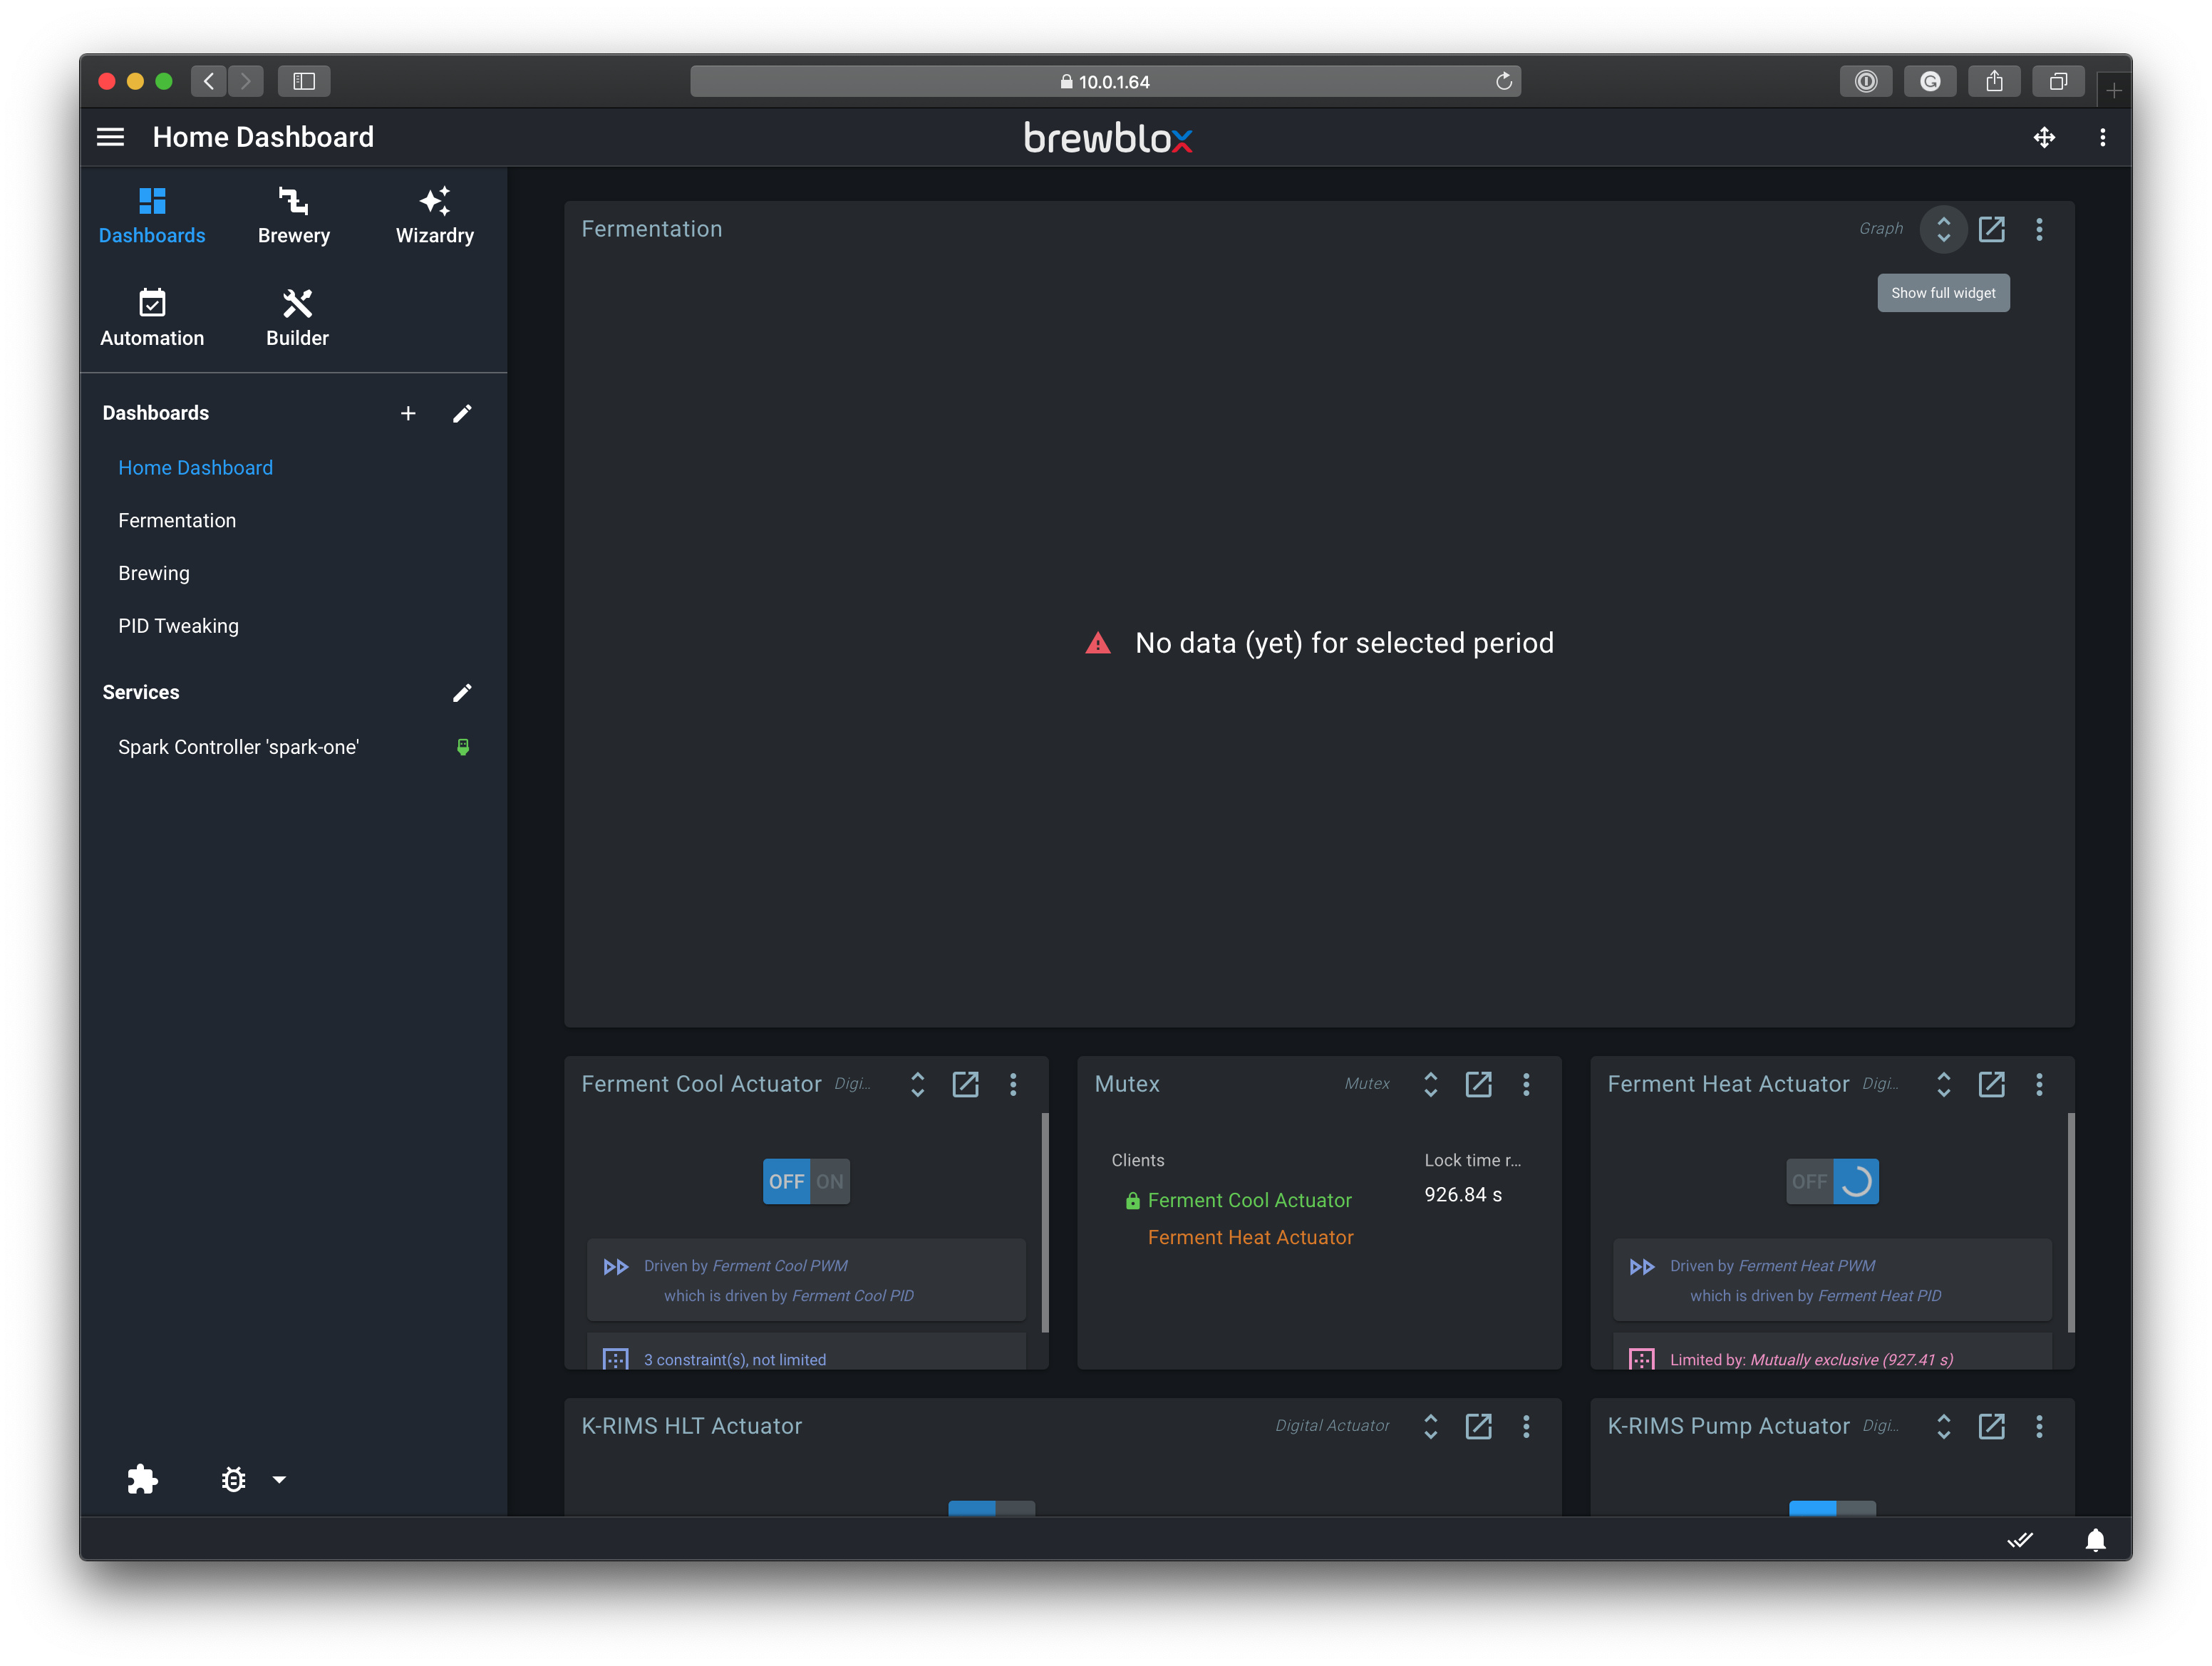
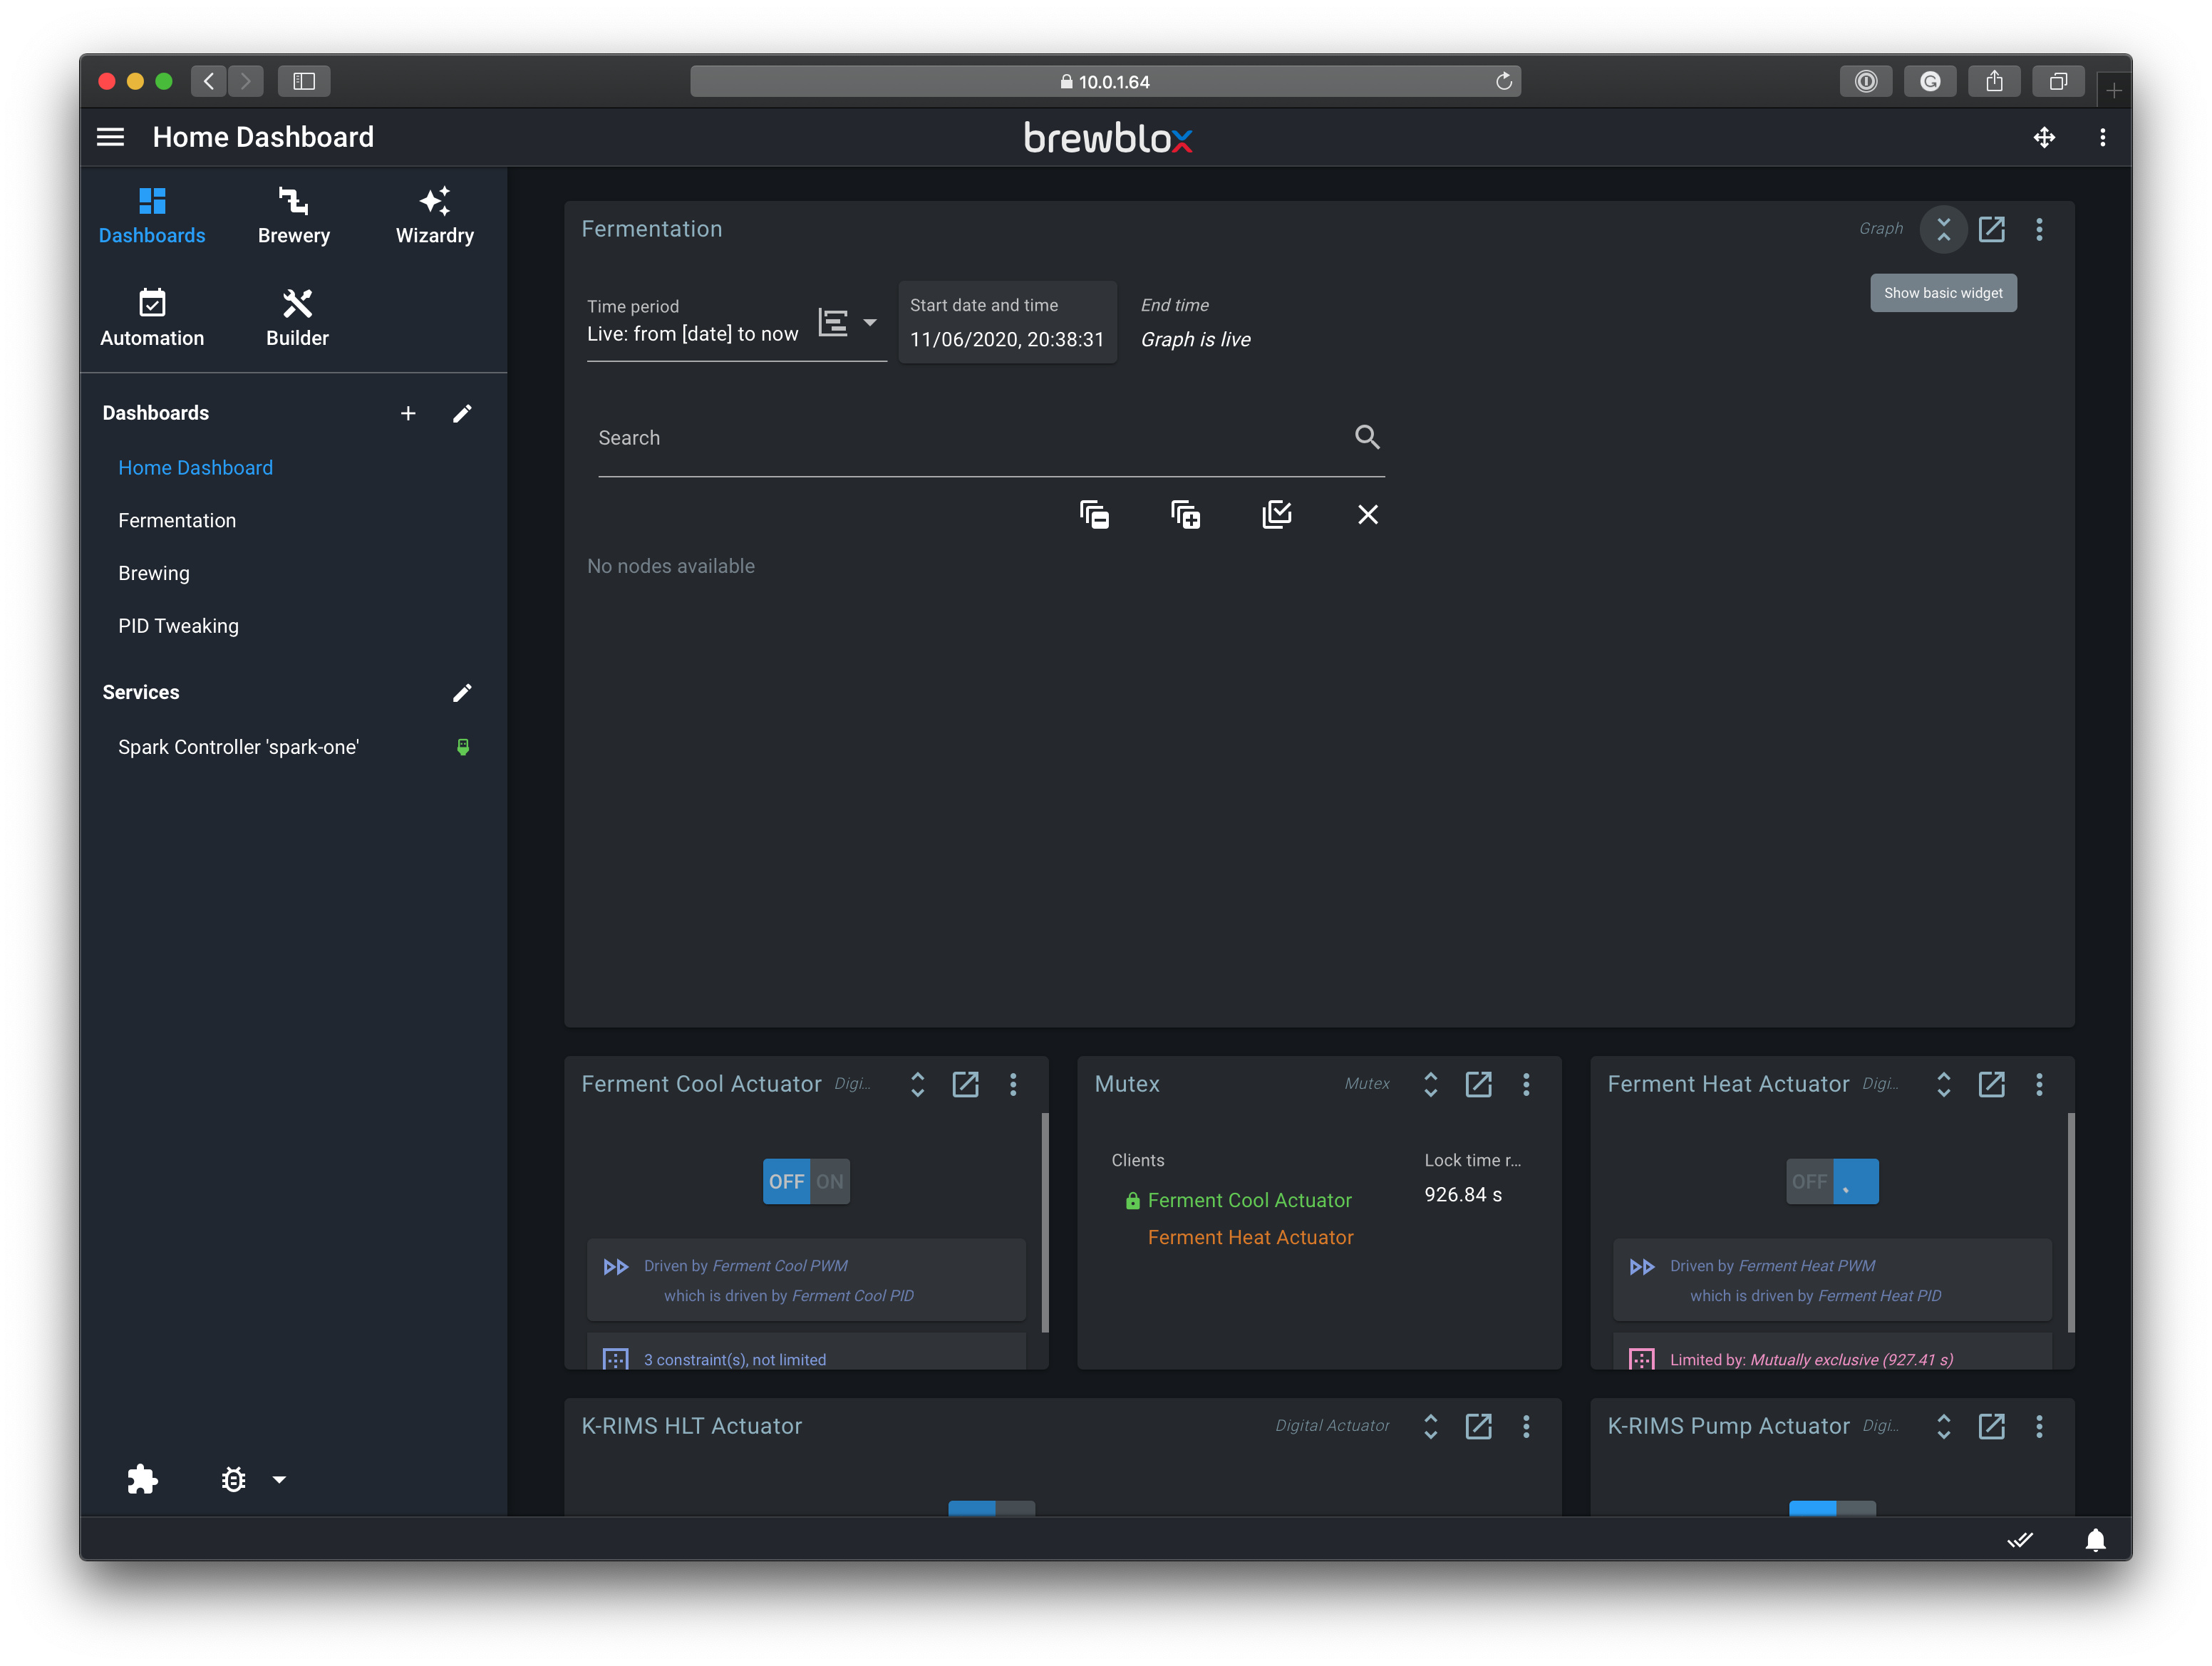
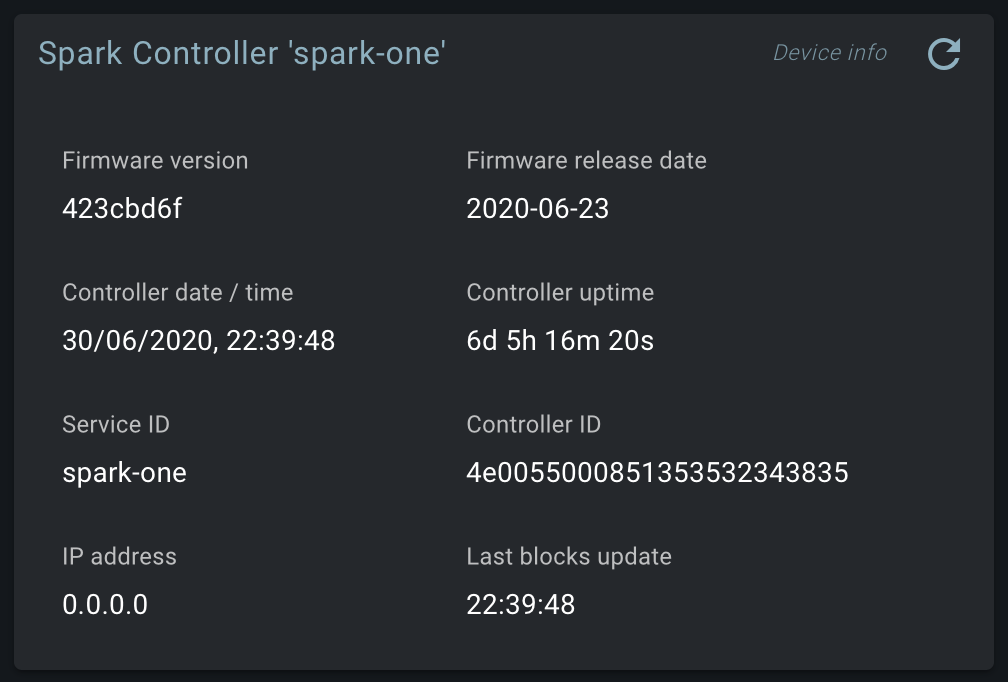
The widget also shows no nodes are available, while the Spark is still green and connected via USB
It looks like I get mqtt connection refused errors?
Although it says on the bottom that Spark One is not found, I do see it in the UI and have had block updates just a few seconds ago
It feels like the system is crashing more than it is working  And can’t seem to figure out what it is… Never had any issues with craftbeerpi running on the same Rpi3
PS:
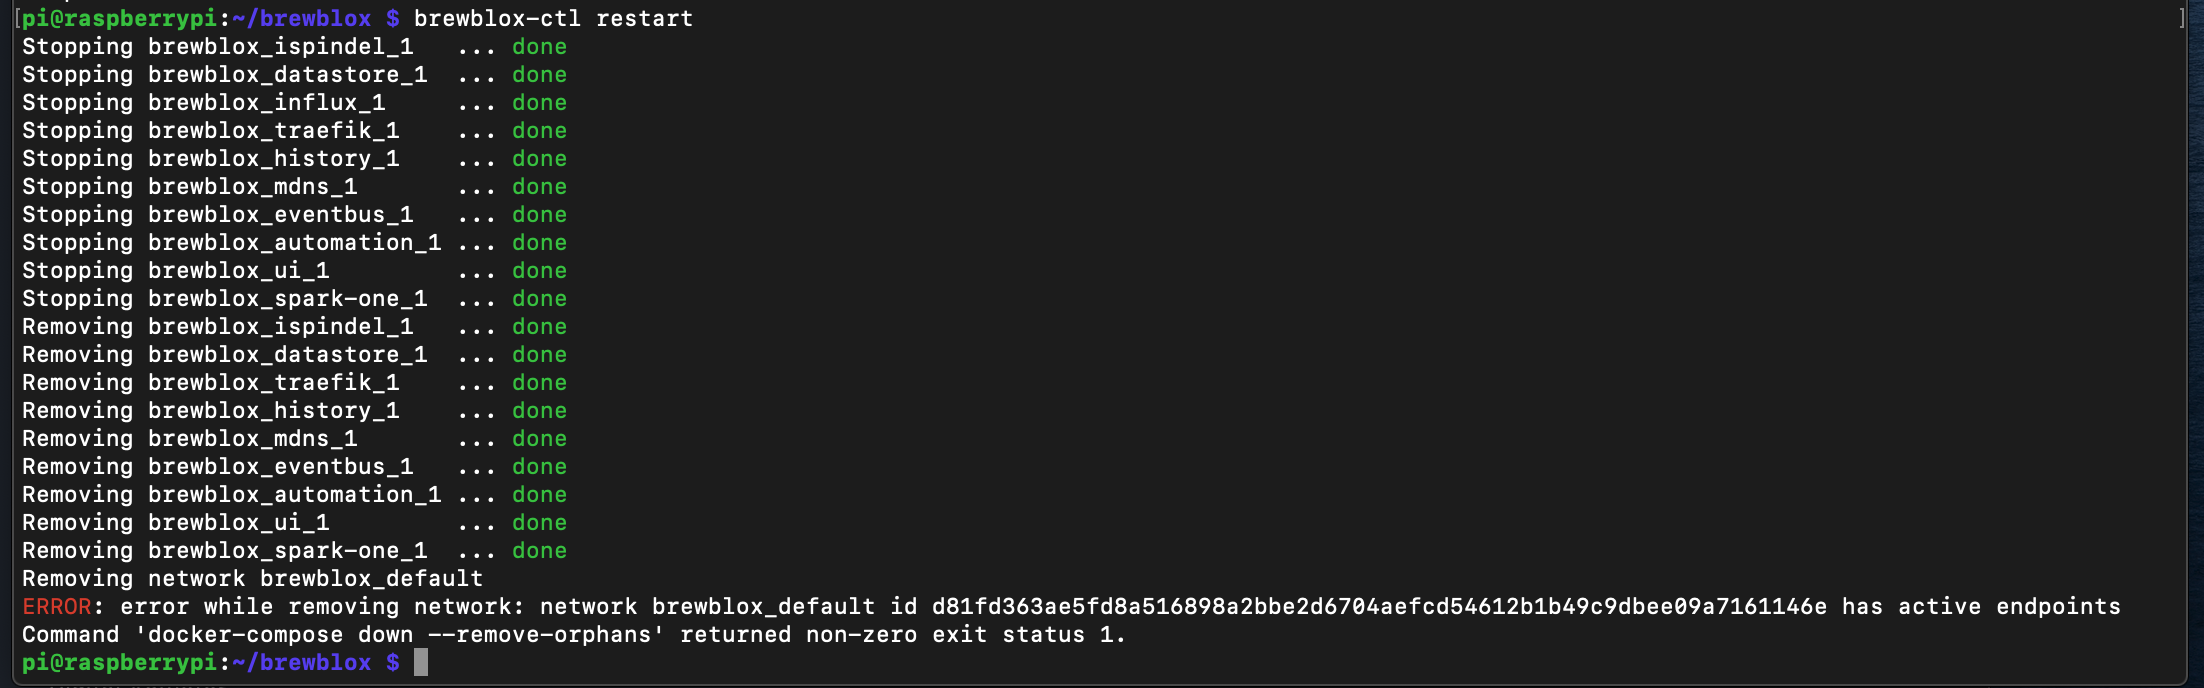
Restarting Brewblox gives me the following error. Have seen this a couple of times before in the last few days… A reboot of the Pi seems the only solution
PS2: I’m misusing the iSpindel service to post the temp in my cellar from another Rpi running NodeRed
Ps3:
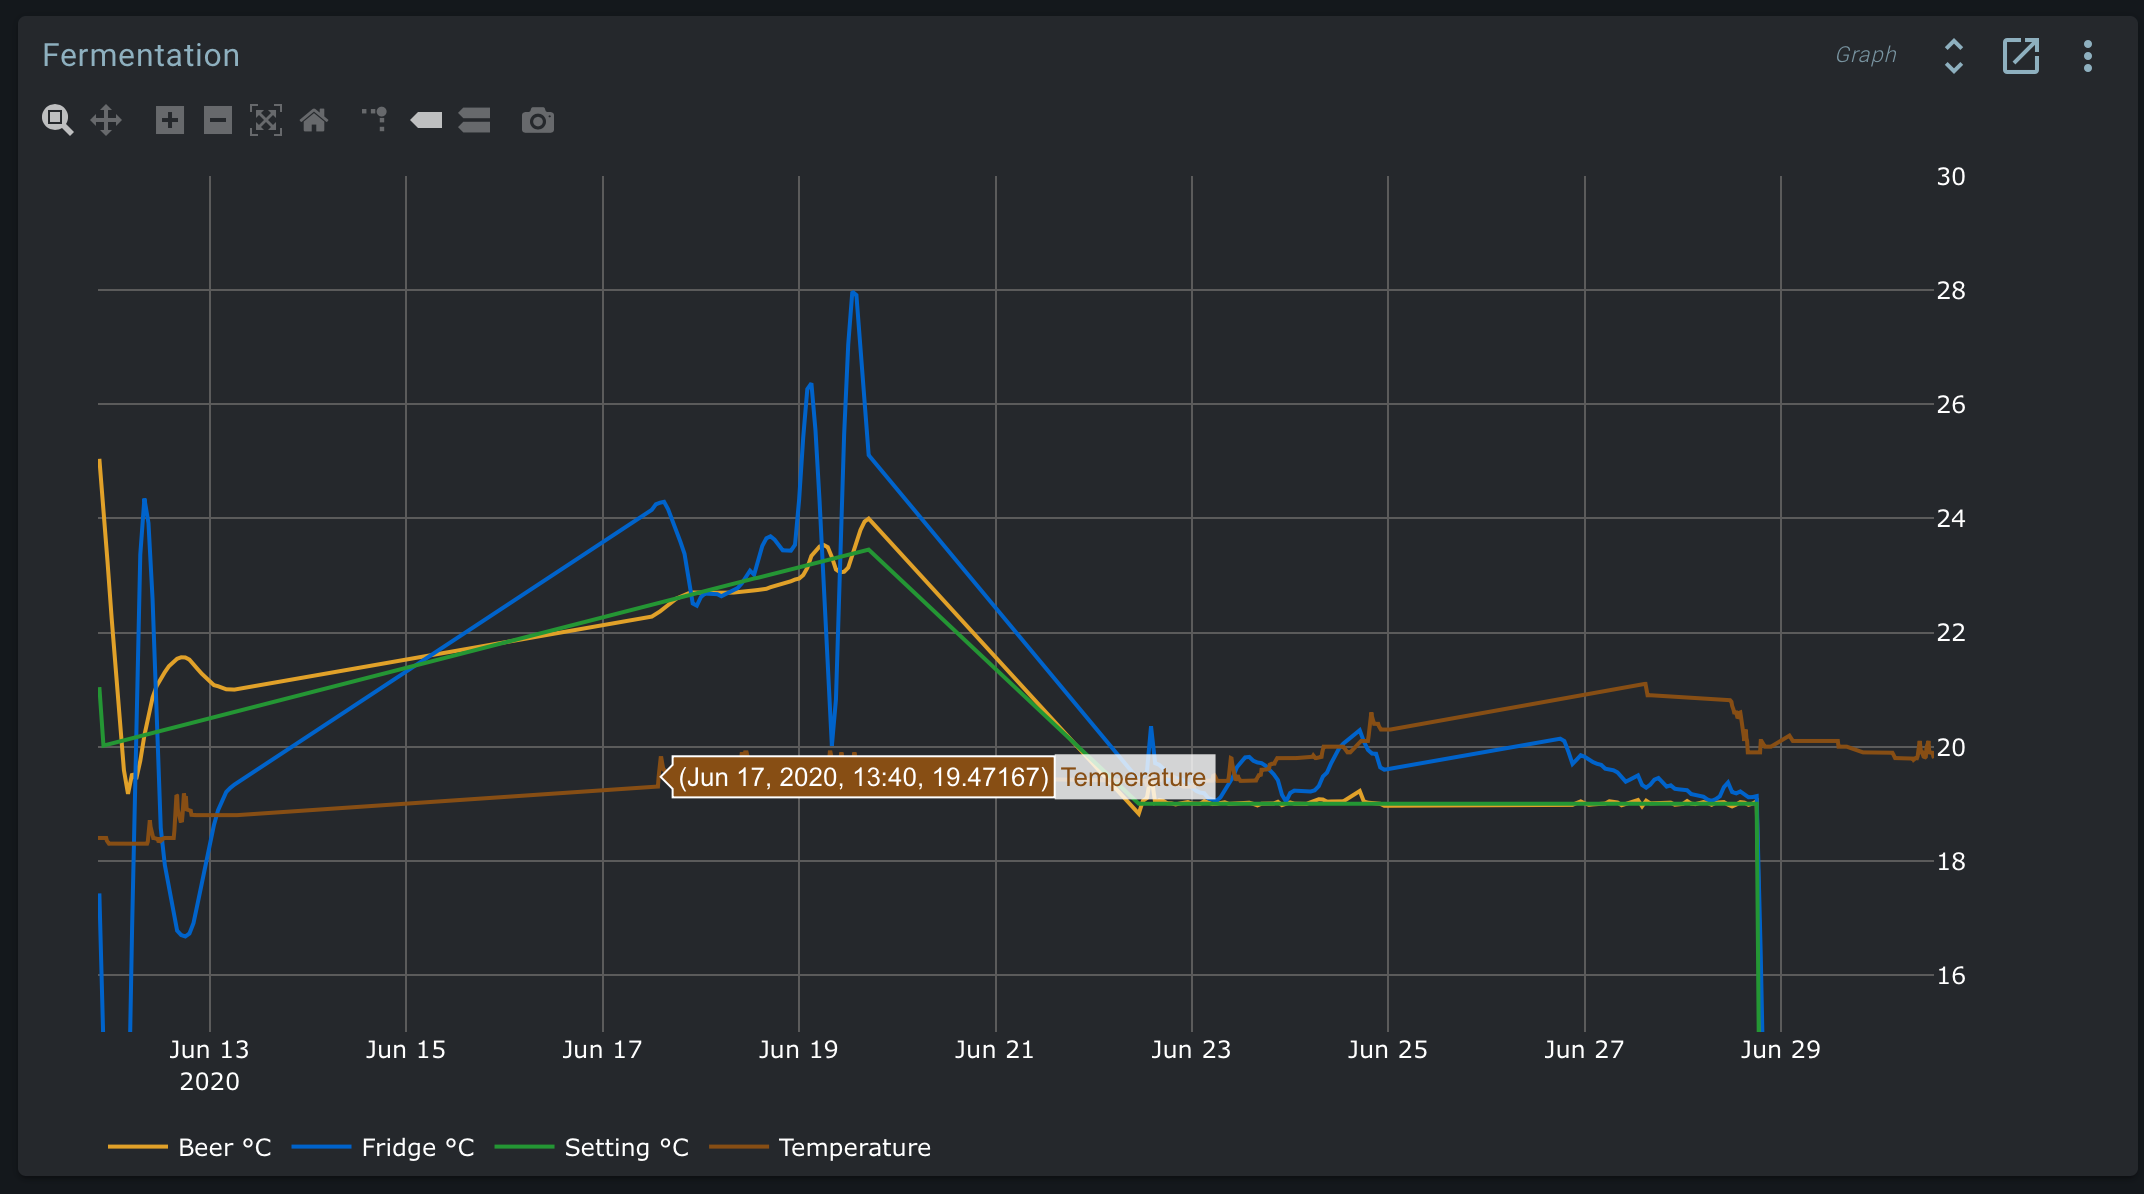
When the graph is working, you can nicely see how much the Rpi is not receiving data by looking at the straight jumps
I’m seeing a lot of reconnects for various services, including the Influx database.
I’m getting suspicious that the RabbitMQ eventbus has issues handling simultaneous AMQP and MQTT connections. While the Tilt service was still using AMQP, it also started acting up for some people. Issues seemed to disappear after it switched protocols.
The iSpindel service was updated today to make the switch. You can apply this by running:
docker-compose pull ispindel
docker-compose up -d
If you get the error about active endpoints, could you please run:
docker ps -a
Does it help if I wait with the upgrade? Or shall I just pull the new ispindel service
Just pull the service. The endpoint error is most likely a symptom of whatever is going on with Influx/RabbitMQ.
1 Like
I was between brews so I did the update and things seemed to work fine.
When I adjusted the graph to show data for a new beer and got the ‘No Data’ message.
The message I was getting on the UI was “DB error in Fetch all objects(spark-presets): Could not connect to the server.”
I tried the steps listed above to do updates and service restart but didn’t have any luck.
My next step was to do a new install and start over.
Things went normal until the brewblox install. The setup program created the brewblox directory in pi/.local/bin.
This has created a few problems since file/directories are where they’re expected.
Any suggestions?
Did it create the brewblox directory there, or did you get a warning from pip about .local/bin?
The latter is something that is fixed when you run exec $SHELL --login.
You can verify whether everything works by running:
cd ~/brewblox
brewblox-ctl service --help
If it runs, everything is fine.
We’re currently working to find and fix the “no data” error.
Somehow the ispindel service is now unable to show any data. The final incoming data point was just before I updated the service. Weird thing is that the service is reporting incoming data:
We just released a hotfix for the UI to fix a typing issue.
You can get it by either running brewblox-ctl update, or (if you already had the latest release), docker-compose pull ui; docker-compose up -d.
- Fixed a typo in the reference enum (setting / measured) for the SetpointDriver block
- If saving a widget or dashboard causes a datastore error, an error message is shown, and the object is rolled back to the latest state in the datastore. You can then retry the change.
- Empty event messages sent by disconnecting services no longer cause an error in the UI.
Is this after you ran brewblox-ctl log? Your history logs only show a query for Cellar and spark-one data.
To verify incoming data, you can add the following to your docker-compose.yml file:
  history:
    command: --debug
Restart by running docker-compose up -d, and your log will now include messages for all received events, formatted as:
history_1 | 2020/07/01 11:34:41 DEBUG brewblox_history.relays MQTT: sparkey = {'ActiveGroups/active/0': 0, '...
Edit: forgot to mention, but your logs indeed now indicate that all services are properly connected to the eventbus.
Let me add the debug! I restarted Brewblox before running the log to see if that would fix it. The ispindel service reports
ispindel_1    | 2020/07/01 10:49:54 INFO     ...x_ispindel.ispindel_service  iSpindel Cellar, temp: 19.6, gravity: 1.1
ispindel_1    | 2020/07/01 10:50:14 INFO     ...x_ispindel.ispindel_service  iSpindel Cellar, temp: 19.6, gravity: 1.1
ispindel_1    | 2020/07/01 10:50:35 INFO     ...x_ispindel.ispindel_service  iSpindel Cellar, temp: 19.6, gravity: 1.1
ispindel_1    | 2020/07/01 10:50:54 INFO     ...x_ispindel.ispindel_service  iSpindel Cellar, temp: 19.6, gravity: 1.1
ispindel_1    | 2020/07/01 10:51:15 INFO     ...x_ispindel.ispindel_service  iSpindel Cellar, temp: 19.6, gravity: 1.1
ispindel_1    | 2020/07/01 10:51:35 INFO     ...x_ispindel.ispindel_service  iSpindel Cellar, temp: 19.6, gravity: 1.1
ispindel_1 | 2020/07/01 10:51:55 INFO ...x_ispindel.ispindel_service iSpindel Cellar, temp: 19.6, gravity: 1.1```I think I found it… Data is being received, but somehow the two iSpindels are combined into one
I will debug the service…
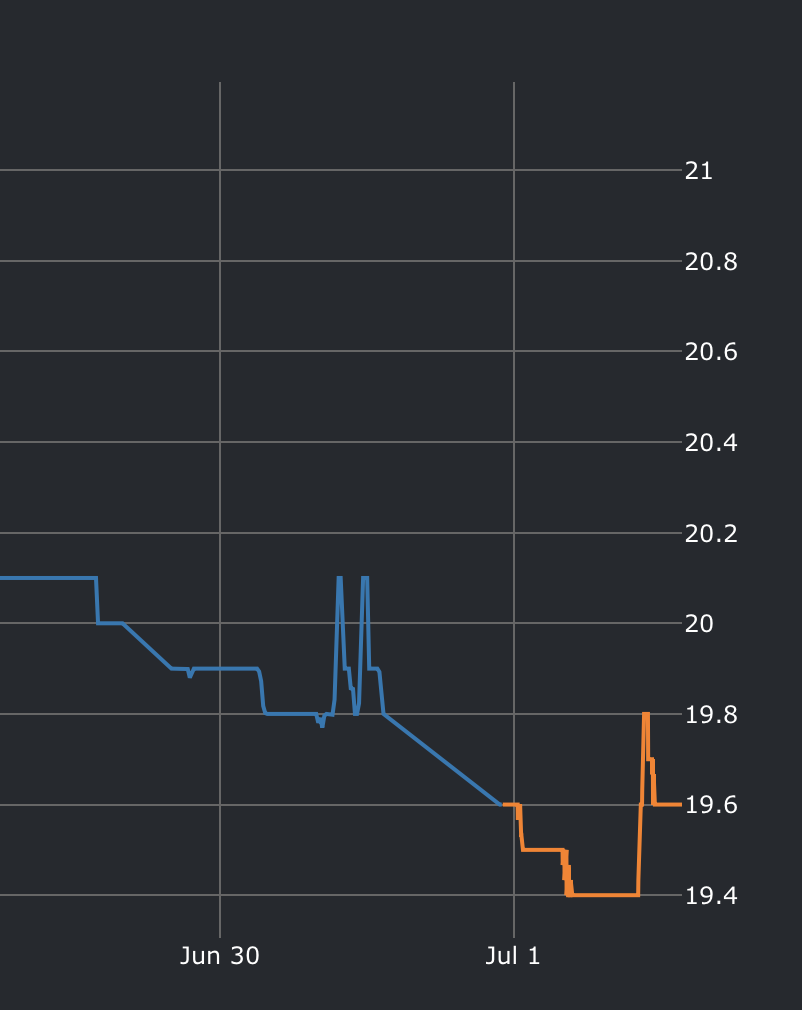
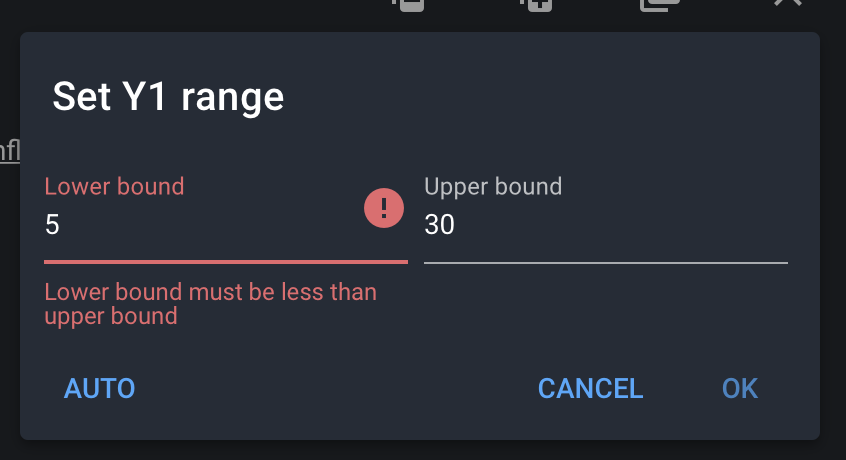
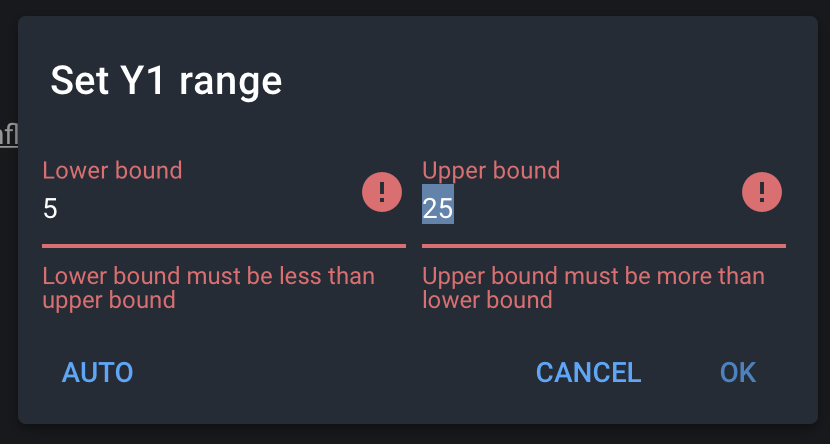
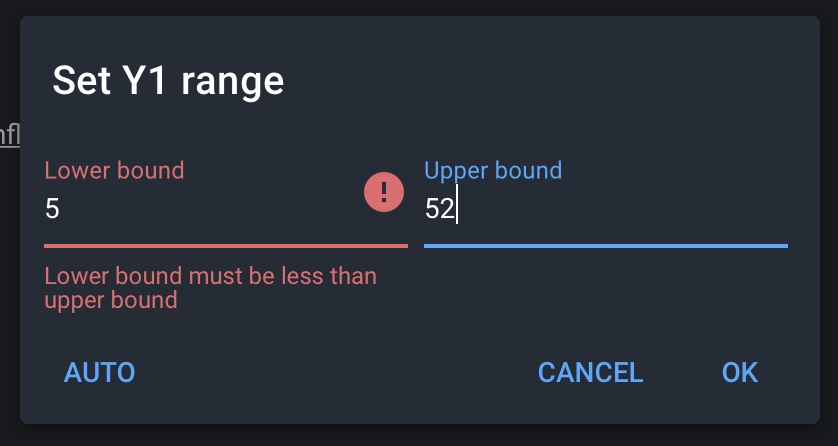
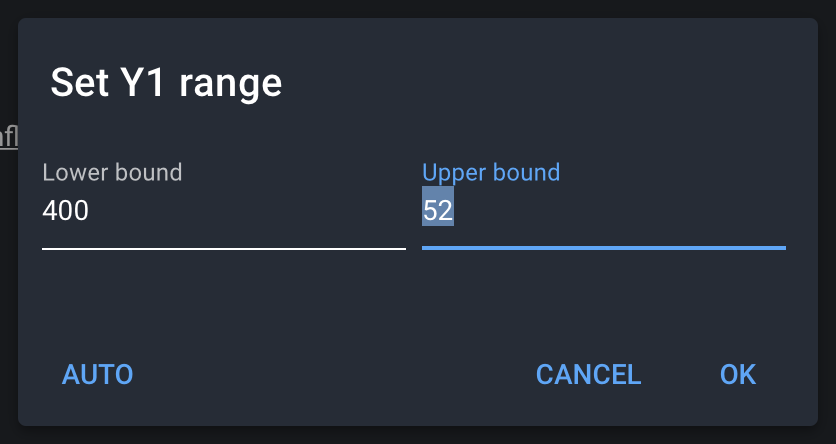
I found another minor bug, it seems that the lower and upper limit of Y-axes are compared as strings instead of numbers?
As far as I know, the iSpindel always pushes events with key=ispindel, so if you have multiple, it will indeed combine data.
@bdelbosc is currently working on a different implementation, where the iSpindels sends data directly to the eventbus, and no longer requires a service.
For your own relay, you also can bypass the ispindel service to directly publish to the eventbus, but that depends on the client-side code.
I’ll have a look at why the UI suddenly thinks boundaries are strings. I suspect some javascript conversion shenannigans are taking place.