Maybe I should! Makes sense… I also found the issue in the iSpindel service and opened a ticket
If it helps, we have some example code for it: https://brewblox.netlify.app/dev/tutorials/pubscript/#source-code
Wrapping it in a docker container is optional, and the paho library also supports half a dozen other languages. Mosquitto also has a CLI tool if you prefer shell scripts.
1 Like
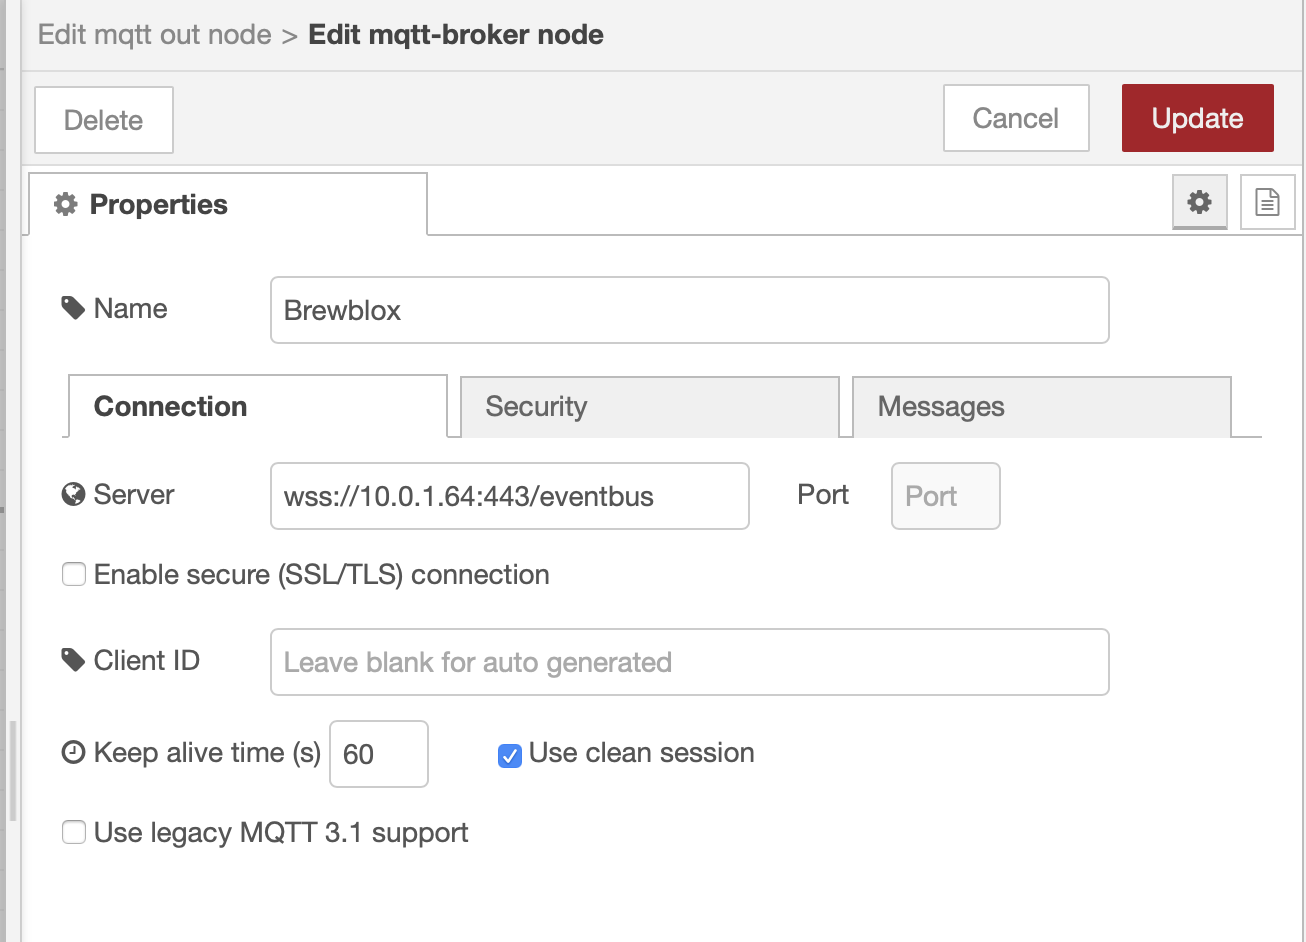
For anyone who wants to publish data from NodeRed directly into the MQTT History queue, this is how I configured it:
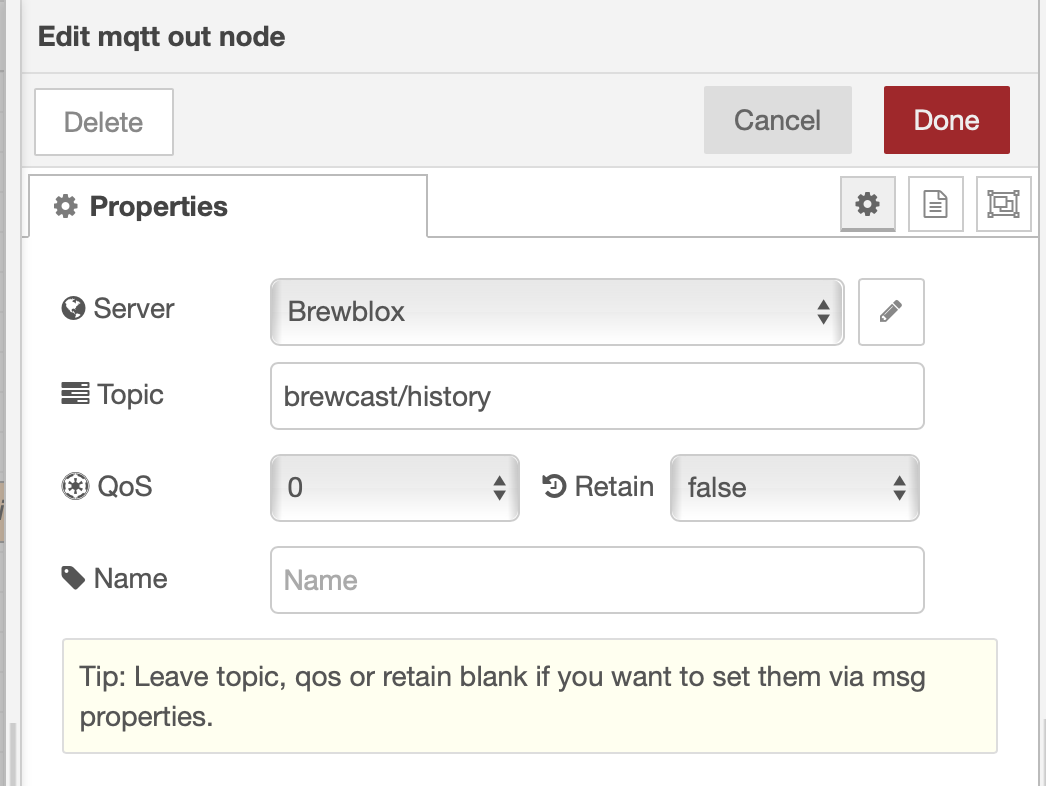

Nice! One note: we automatically downsample data sets by averaging them. Any string fields (in this case: data.name) are discarded.
Good point, name is also no longer needed, since we have key
The directory was created.
The controller is still running keeping so my Scottish ale fermenting along at 62F so this isn’t a beer emergency.
I’m at work all day so I’ll rebuild it again tomorrow and let you know how it goes.
Brewblox installs have no external file references, so you can also copy the entire directory.
sudo cp -rfp ~/.local/bin/brewblox ~/brewblox
The -p flag prevents sudo from changing file owner.
If you accidentally used .local/bin itself as the brewblox dir, then these are the files you’ll have to manually move or remove:
├── brewblox_ctl_lib/
├── couchdb/
├── influxdb/
├── traefik/
├── docker-compose.shared.yml
├── docker-compose.yml
└── .env
After a couple of fresh builds I have it going again.
It looks like the graph is working again as well.
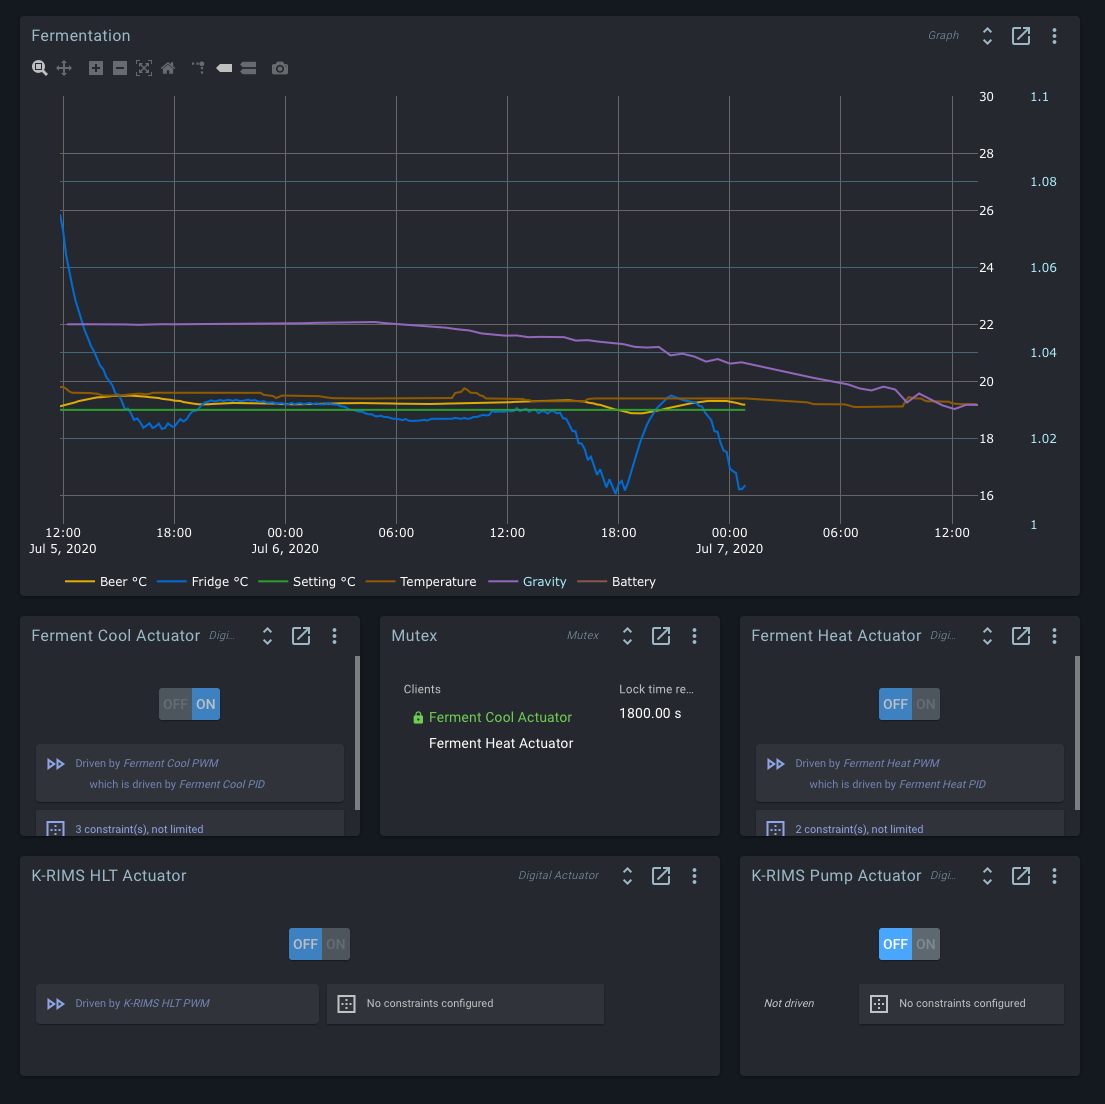
It seems the spark has stopped reporting data. Although the Spark is connectable. The two lines that do continue are NodeRed and an iSpindel sending data directly to MQTT
Looking at the logs, could it be possible that me sending a string to MQTT has broken the history?
Your controller is currently reporting a panic as reboot reason, and the service has trouble connecting. What are the two memory usage values displayed on the LCD?
Power cycling the controller may clear up the issue, and at least clarify whether the panic reboot repeats itself.
Something was stubbornly attempting to write a string to a non-string block field. The timing suggests an automation action. Is there a currently active process retrying a block write action?
The string error is reported by the blocks/write REST endpoint. This is not related to any MQTT messaging going on. We don’t support using event messages to write blocks.
A reboot of the raspberry seems to have solved the issue. I’m not at home, so haven’t seen the display. The Pi had enough memory, but it really is the Spark running out of memory?
The Pi was rebooted yesterday because of another crash, so no active automation. Just fermenting… Is there anything I can do to prevent these panics? Not 2 days go by before the whole system crashes and I’m out of my depth here. The only thing I haven’t tried is buying a new Raspberry Pi. Currently running a 3B+ model, but I understood the 4 is not yet recommended?
Any active automation processes are resumed after a Pi reboot. You can check if any are active in the automation widget.
These problems don’t appear to be caused by your Pi. It looks like you’re using USB. Unless you’re also using an external power supply, rebooting the Pi also power cycled the Spark (power supply to USB ports is interrupted during a reboot).
The Pi 2, 3, and 4 are all supported. We’re currently using a Pi 4 to control a test fridge in the office.
Panic errors are typically caused by memory violations, hence the request to check memory use on the Spark.
This does not mean they are expected or accepted. Next release includes improved tracing of controller actions, to help us find the remaining bugs that express themselves as “controller suddenly reboots”.
It seems the automation service has crashed, at least I’m getting:

My Spark is running on an external power supply because checking the Spark pins widget, the Spark was not supplying enough on the 5V output with just the USB from the Pi and I hoped by supplying more solid power would reduce the number of crashes.
Currently, the Spark consumes 72% 82% (CPU / memory or the other way around?)
I have a Fridge setup and a K-RIMS setup with, in total, 29 blocks. I could probably remove 5 blocks since I’m not using the double PID setup for the fridge while I do have the blocks installed. Is 29 too much?
The automation service is early-stages experimental. If its potential impact on system stability is an issue, you can disable it (run brewblox-ctl service remove, or comment in config and run brewblox-ctl up).
Percentages are current/peak memory, and they’re both fine. >90% is where you start getting issues. Typically that’s with 60+ blocks.
Could you please run brewblox-ctl particle -c eeprom to export current Spark memory?
Okay, let me disable the automation service and see if that helps
1 Like
Bob, this is awesome. Got everything updated and it’s working great. Question: will you be re-implementing the degF in Automation? Either that, or have you fixed the problem that occurs if my UI settings are in degF but my automation conditions are in degC (automation doesn’t work in this case)?
Maybe it’s finally time that this American gets himself calibrated to the metric system 
While I can recommend the metric system, degF will be supported. I did check the current implementation, and it appears that units are completely ignored in automation conditions. It always uses the number value generated by the service (in your case, degF).
Next release includes two separate fixes:
The system automatically detects whether you’re using degC or degF for that service. You no longer get a dropdown in the automation condition, but an auto-filled degF.
Because for anything not trivial, the configuration / UI layout was getting overly complex, we’re testing a different approach, where we allow sandboxed Javascript to run in the automation service.
In the UI, you can either write whatever condition and modifiers you want, or use UI elements that let you pick a block / field from a dropdown, and then generate the syntax for you.
An example condition would be:
return getBlockField('spark-one', 'Ferment Fridge Sensor', 'value[degF]') >= 70
We think that approach can work both for people who want a UI-based configuration (click through a mini-wizard, and it generates this for you), and for those who want a condition that only evaluates true every second thursday if the combined value from the fridge and beer sensors is a multiple of 7.
1 Like
Another day, another crash… but this time I can’t seem to recover… restarted Brewblox, rebooted the pi, power cycled the Spark, but still:

Logs before restart: https://termbin.com/clo4
Logs after reboot: https://termbin.com/u9ew
Memory usage before restart Spark: 72% 82%
After restart Spark: 72% 82%
I removed the automation service last time and removed unused blocks for 2 PID fermentation as well…
Many strange errors in the logs, for rabbitmq, unexpected messages, unable to connect to influx.
The Spark itself seem to run fine. I also tried your eeprom dump on a spark here and it ran fine.
I suspect file system problems or power supply problems on the pi. Too many strange things happening at once. Can you run a file system check on it?
If the SD card has exhausted its write cycles, it will go into read-only mode to avoid data loss. That’s why a bigger card is better to have more room for wear leveling.
Let me run the check, but it’s a 32GB SanDisk I ordered 20 December 2019 as part of my search to try and find why my system is constantly crashing. I also upgraded the power adapter to an official Pi adapter earlier this year. The Spark runs on it’s own 12V adapter to exclude problems at that side as well…