@sbowler, I copied all of the files and sub folders to the appropriate places and over wrote any file that existed. There is no mention of index.php or css files in the instructions? what is different on my screen?
I haven’t setup any temp probes on this one yet.
Rich
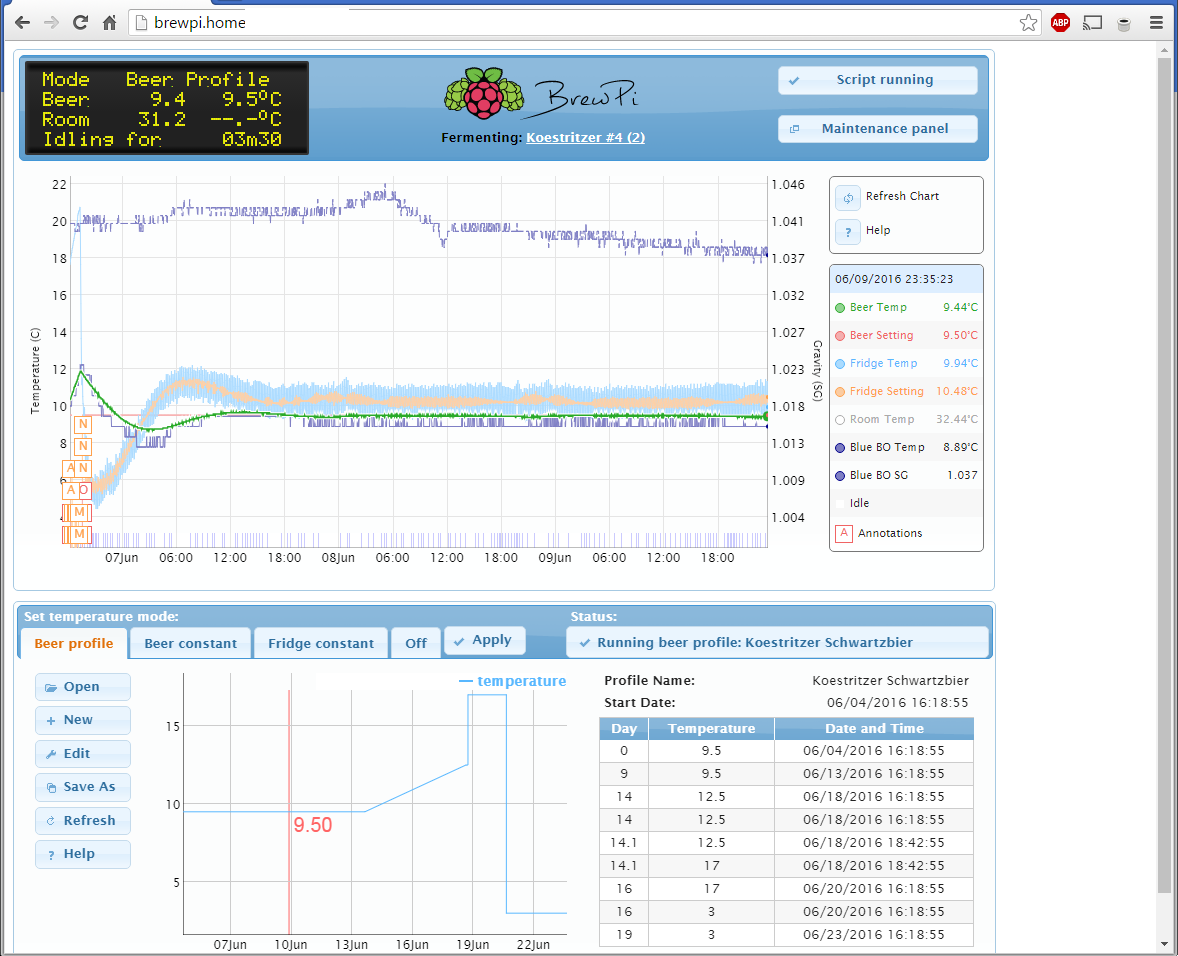
If you copied all the files then you’ve done the right steps. The main thing I noticed is that there’s no black ‘circle’ next to the ‘Black BO Temp’ and ‘Black BO SG’ text like there is a red and orange circle for the beer and fridge settings.
I’ll do some testing tomorrow to see what might be going on.
I can’t speak for the accuracy yet, but unfortunately using one of there for the temp control will not work with the current brewpi solution. The Spark/Photon is responsible for the temp control and reads directly from the wired thermometers. The brewometer temperature is coming in via the raspberry pi, so the Spark’s temperature control algorithm has no visibility of these values.
@rbpalmer - I did some testing and there should be the “black dot” for the Black brewometer legend lines… Can you check that the brewometer.css file is in your /var/www/css directory?
@sbowler brewometer.css is indeed in the css folder. my only difference could be thatI am on Rasbian jessie and the apache root is /var/www/html so css is /var/www/html/css. don’t know if that would make a difference?
That’s weird then. Everything that should be there is there. I can see from your screenshot above that the legend styling and the axis label styles are not being loaded from the brewometer.css file.
Can you take a screenshot again? Which browser are you using?
The other thing to try is to see if the brewometer.css file is able to be found by the browser… So type the address http://<ip address of brewpi>/css/brewometer.css and see if the file comes down.
have worked out what the problem is, its not with your work but I have allowed access form the internet and based on the site External Access, which I now realise has created a new index.php page called admin.php which I need to add your css file to.
@sbowler, I have managed to find the bits that were missing and all is displaying correctly now.
I’ve pushed an update to the files to enable smoothing of the read values and calibration. You will need to install the python-scipy and python-numpy libraries if you already have the brewometer changes installed.
I’m trying not to add too many lines to the brewpy.py file to keep it as close to the original as possible, so if you’d like to play with the smoothing values, the settings can be found on line #426.
It’s currently set to do a median of the values over a 5 min period (300). The second value ‘10000’ can be used to specify a moving average window (reduces short/small noise). if you’d like to see changes quicker. At the moment I have this disabled as I found that using a simple 5 min median gave me a SG swing of 0.001 and reduced most of the temperature noise.
Calibration instructions can be found in the README file and in the example files provided.
Just installed your code, which went pretty smooth. A few comments on the install, in case others run into it:
upgrade to a recent version of brewpi first, there is a upgrade script in brewpi-tools that does a very good job
On my brewpi (wheezy), setcap (to enable BT w/o root) wasn’t installed, you can get it via ‘sudo apt-get install libcap2-bin’
In case you have a current brew already logging, stop the log first
When copying the new files over the brewpi install, make sure you change the ownership to what you’re replacing. For /var/www it was ‘www-data’ for me, and for /home/brewpi just ‘brewpi’.
Would it make sense to clone @Elco’s two repositories that hold your modifications to your github repository and add the changes there? This way one could just clone/pull your repository in the future (afaik Elco’s update script could even handle future updates that way), and you could also just create a git pull request on Elco’s repo, which would make it easy for him to merge this into his repo, if he so chooses.
On the SG graph, when fermentation is just starting out, the y2 axis values are fairly narrow, which creates a bit of a busy chart when the brewometer flips between a few gravity points. I’d suggest to make the minimum y2 axis around 0.02 or 0.025 or so, this way the graph wouldn’t go over the entire charting area when starting out. I forked your repo, and took a gander thru the code, however I’ve come up empty so far where I could change that (never used the dygraph stuff). Got a pointer where to start looking?
It does make sense to clone the repository. I originally started with this in mind, but I found that the repository contained a lot of changes for upcoming versions in the mainline. However, I think I may have been on the develop branch, so will look at re-attempting that.
Thanks for the suggestion. I’ve implemented a minimum bound to the graph, so that it will automatically scale to your range. If you prefer to use a fixed range (i.e. 1.2-> 1.0), then feel free to modify the code. The configuration is on Line 466 of js/beer-chart.js:
valueRange: [0.990, null]
The null in the above code means that it will automatically scale to your maximum value (which will be the value at the start of ferment). The 0.990 just gives it a bit of room at the bottom of the graph, in case you are fermenting a REALLY dry beer.
So, this worked out really well, I used 1.00 for the min (I don’t think I’ll ever make a beer that goes below that), and the chart is now what I was hoping to see. Thanks for that advice! Attached is a screen shot of the current brew.
One thing I noticed, tho, is that rendering the new graph on my iPad Air 2 appears to be quite a struggle. I’d expected it to take a bit longer, but it seems to tax quite a bit more than expected to get a graph up. I’m gonna see if I can figure out where that comes from and report back.
This is probably due to the additional data in the BrewPi logging data structure. To make it fit in with the existing BrewPi logging/display mechanism there are placeholders for all the Brewometer colours… This means that if you have 1 active Brewometer, you will also have 14 logged nulls for every data point.