Yes, this now makes sense if there is a lot of extra data being xmitted/parsed.
I had logging set to 10 seconds, I changed it to 1 min now. Will this help with the existing graph, or only going forward?
Cheers,
-Th
Yes, this now makes sense if there is a lot of extra data being xmitted/parsed.
I had logging set to 10 seconds, I changed it to 1 min now. Will this help with the existing graph, or only going forward?
Cheers,
-Th
I believe only going forward.
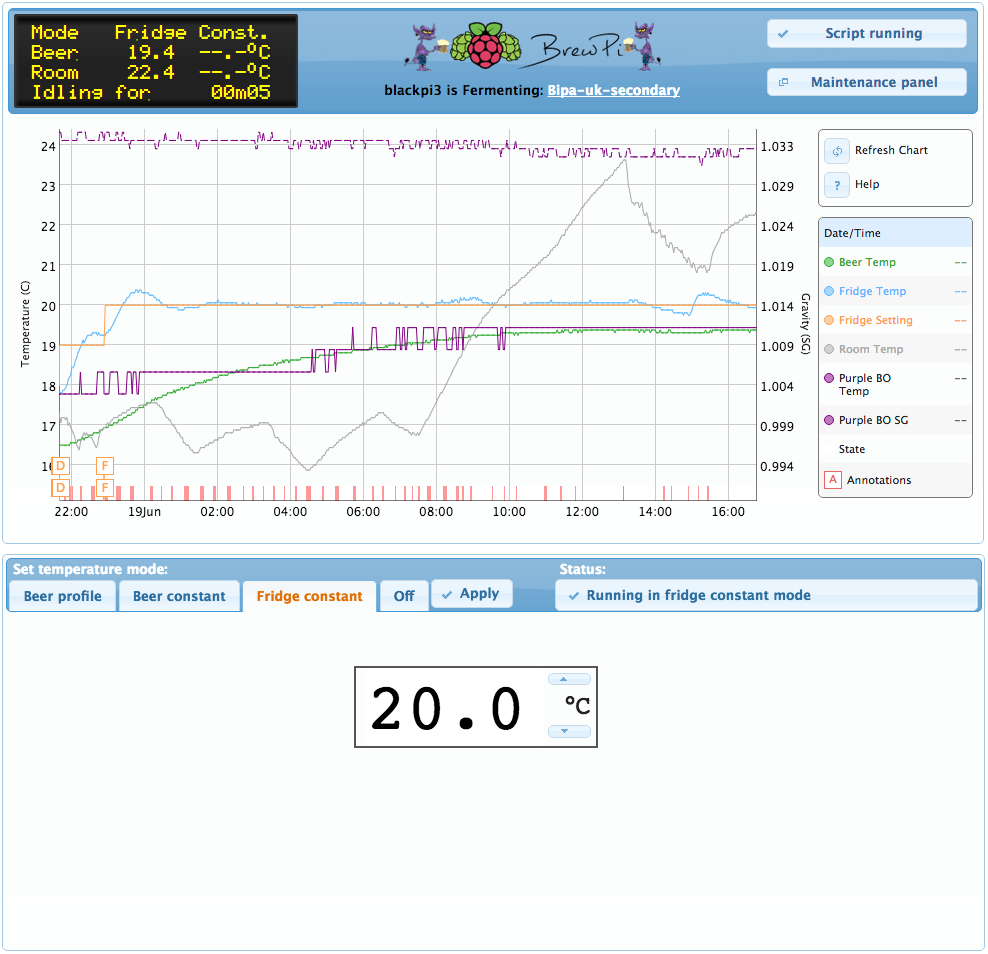
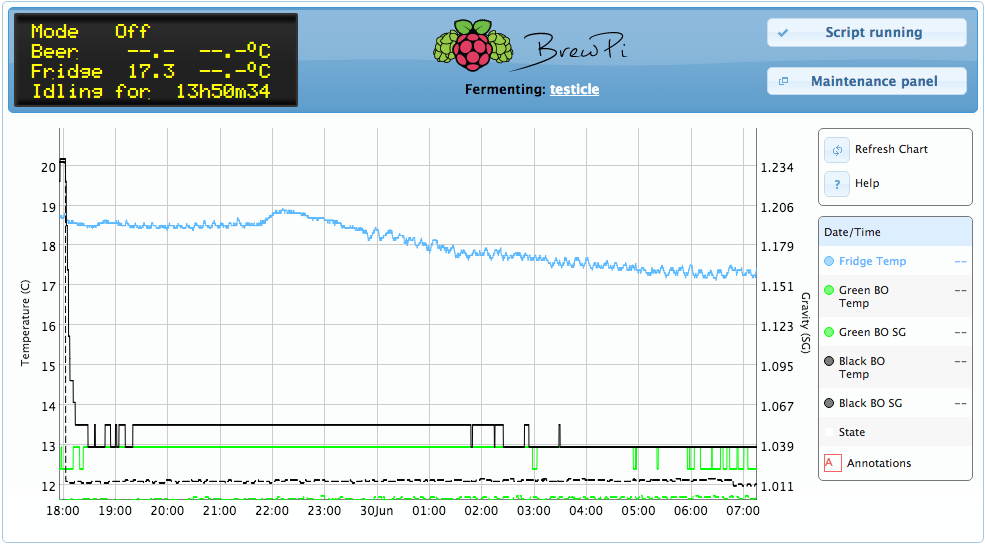
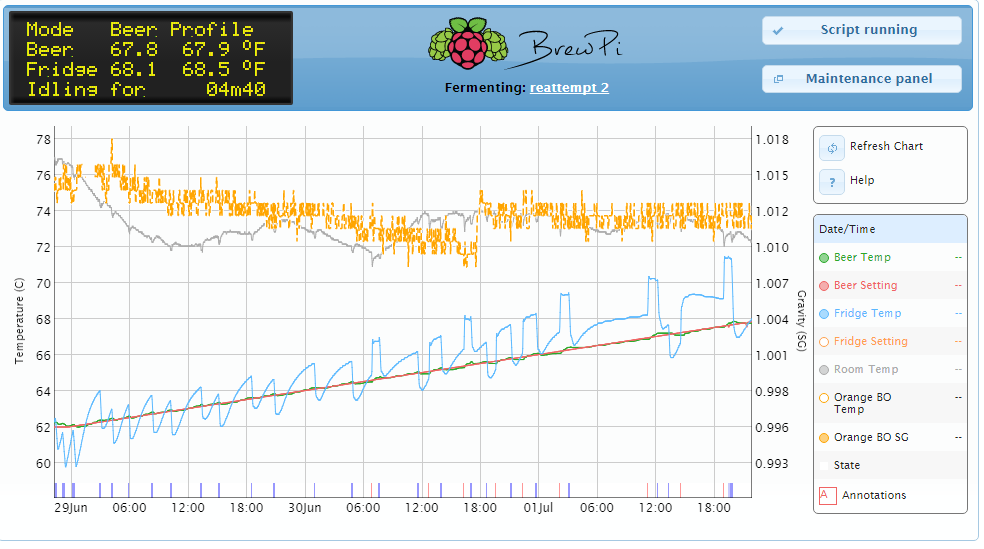
@sbowler my brewometer arrived midweek and this weekend I have added your code to one of my Pi’s when I transferred my UK only hopped Black IPA into the secondary. The odd beer sensor curve is from the beer sensor going into a bottle of cool water as this secondary doesn’t have a thermowell… Thanks for your efforts its working really well.
@sbowler this is great (Thank you!), but I’m running 0.2.10 on Arduino, do you think it’s possible to use the code in the scripts related to the brewometer in the files that are compatible with my version? I’d love to get this to work but I don’t have the spark.
Raine, I like what you have done. Have you shared this elsewhere in the forum? If not would you, please?
Hi @jvgolf. The code itself runs on the raspberry pi, so shouldn’t be effected by whether you’re using arduino or spark.
If your brewpi scripts aren’t the latest version, the code will be compatible, but you’ll need to manually add the changes yourself.
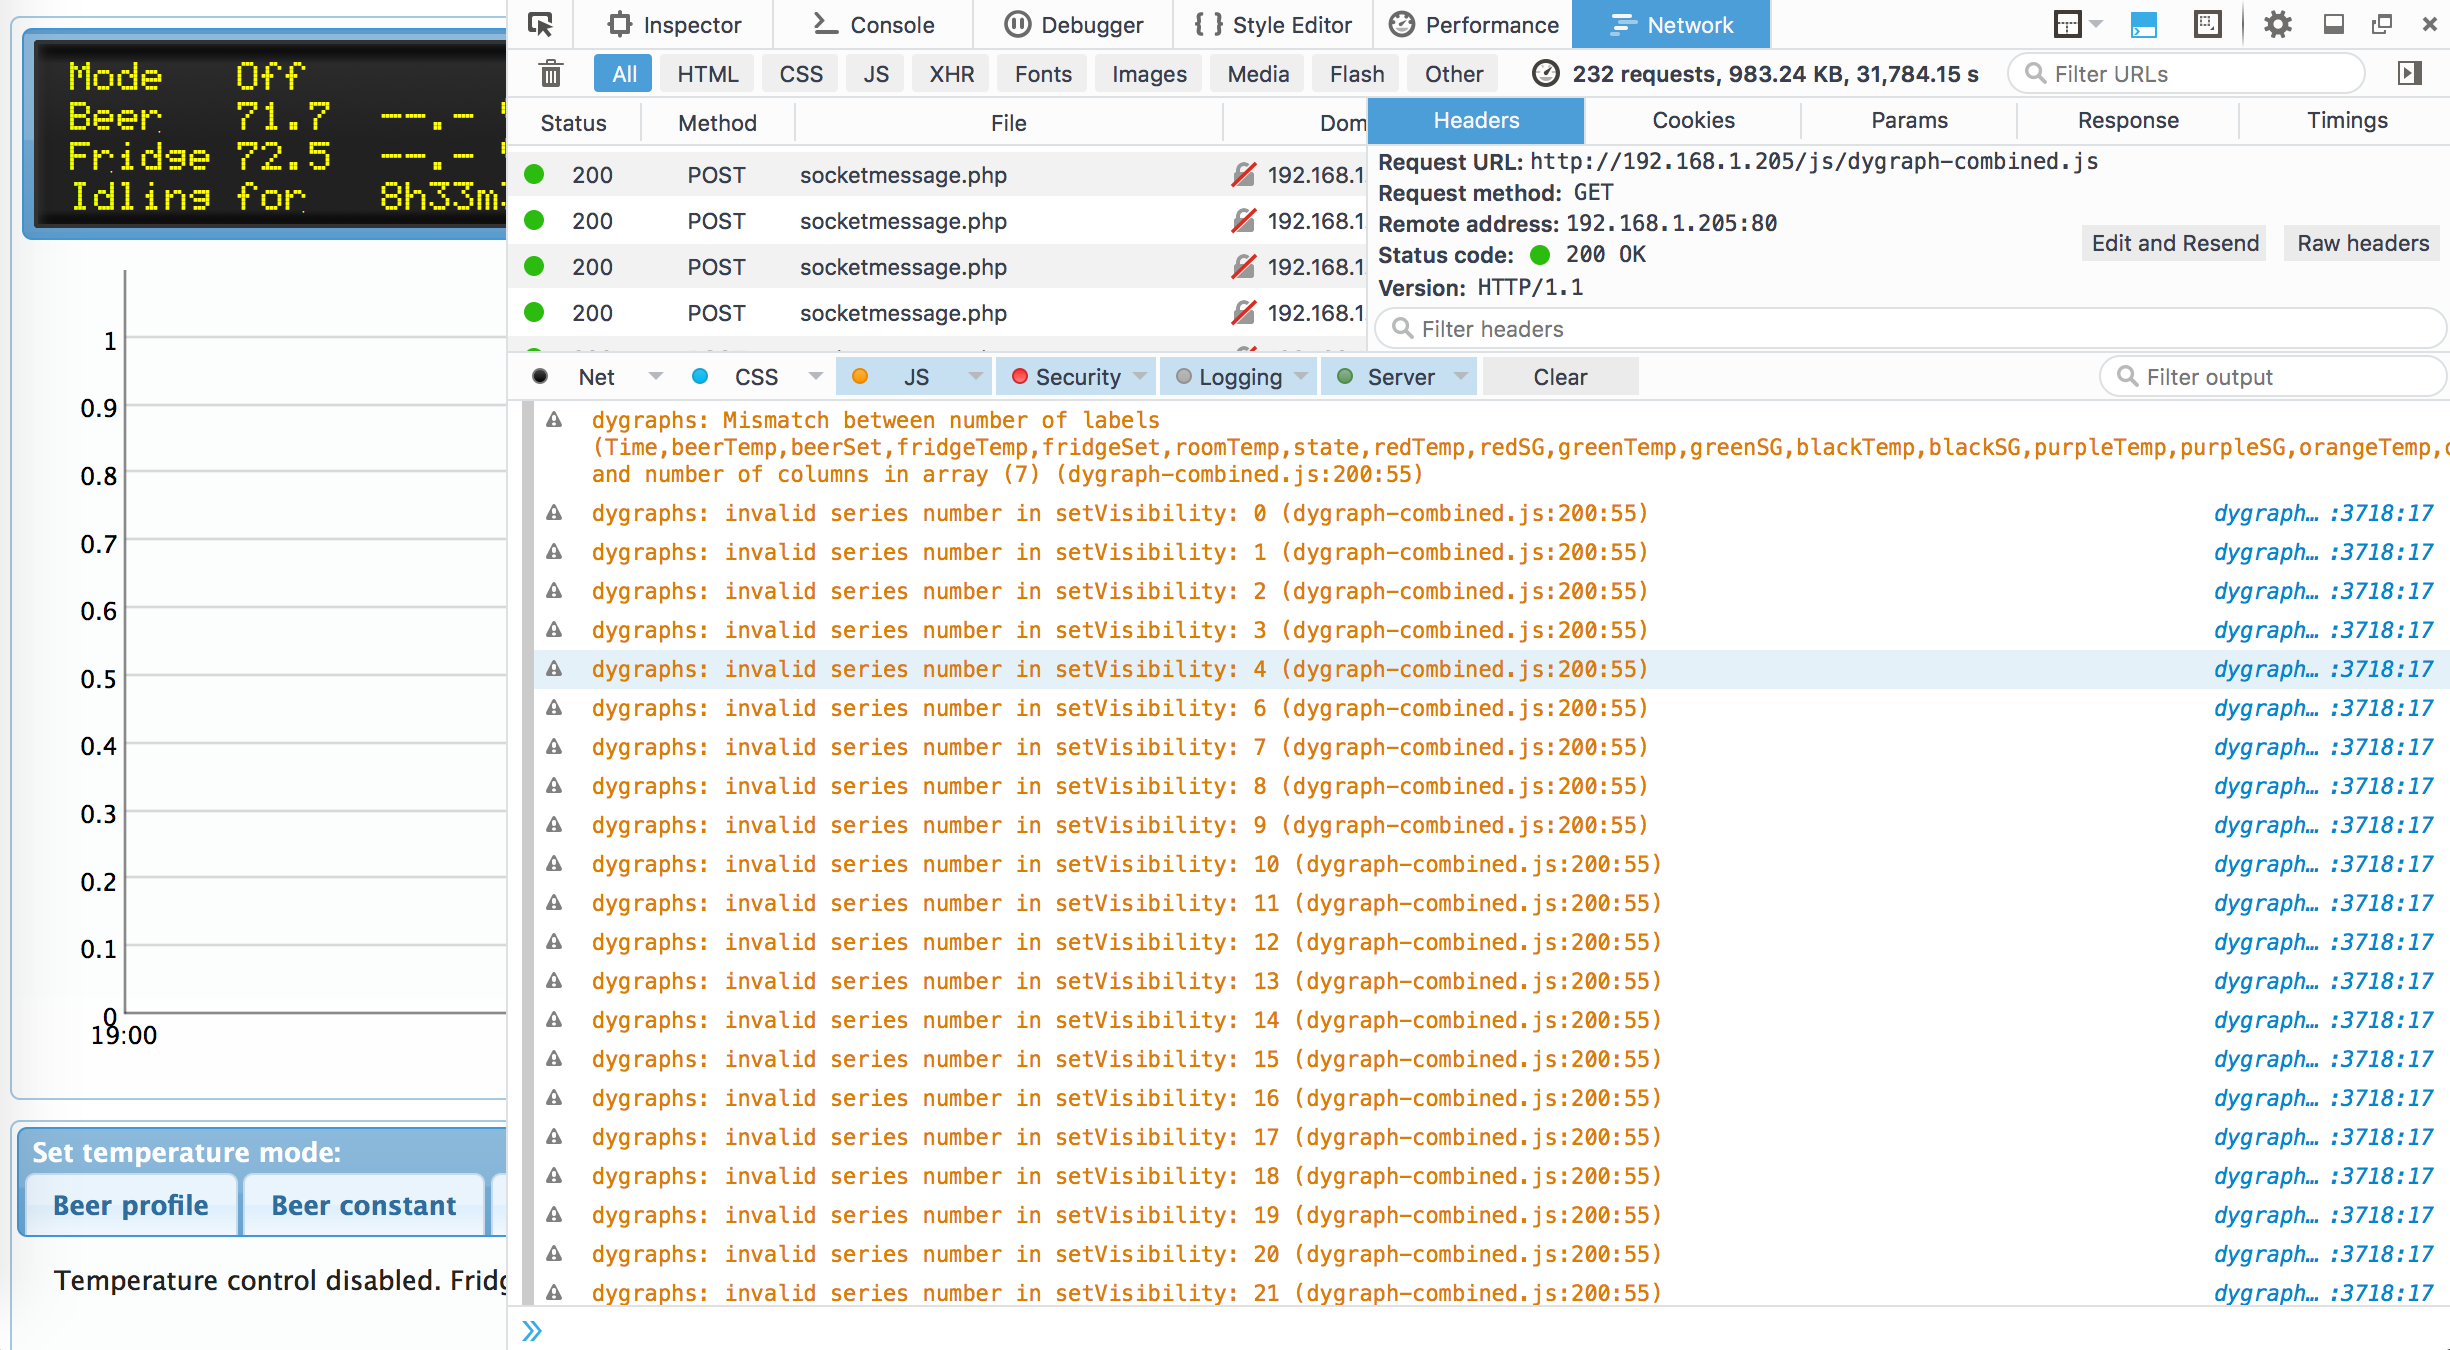
I got it working on the script side and the JSON file appears to be correct, but I’m getting an error in drawing the chart (all the legend entries are hidden and dygraph-combined.js is giving me errors). Any thoughts about why this is happening?
It looks like you haven’t done the changes to the brewpi.py script file to record the brewometer data. This modification adds additional columns to the data stored in the log files.
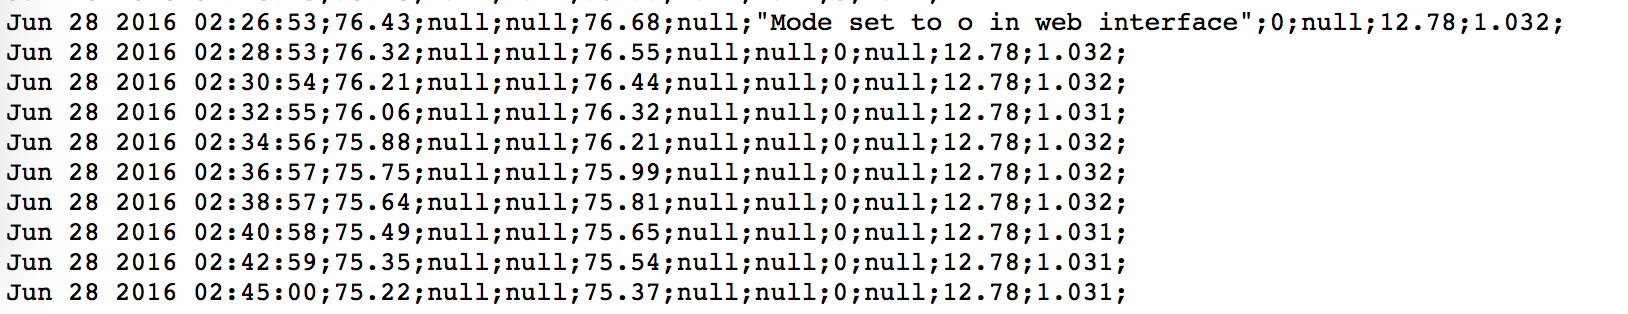
I thought I got all of it, this is a screenshot of the CSV file and I see the brewometer temp & sg data at the end of it. Maybe I missed a section though, I’ll re-check it tonight.
Ok so I figured it out, I had to start a new brew for it to work.
Just got my Brewometer, excited to try it out on my next batch!
another one to say thanks!
i’ve got some test graphs going with water and ambient temperature… looks like i’m getting +/- 0.5c jumps on the temperature, is this rounding?
looking good! though i think you have labelled est og and est fg the wrong way around?
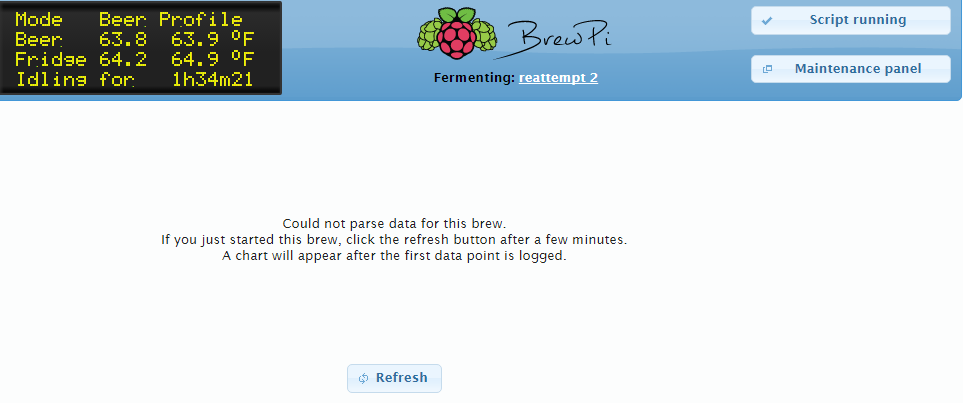
Hi all, any pointers on resolving an issue where there persistently is no graph and “can’t parse” error message?
Could not parse data for this brew.
If you just started this brew, click the refresh button after a few minutes.
A chart will appear after the first data point is logged.
Like jvgolf, I am running legacy branches as I’m using an Arduino. After realizing the hard way that sbowler’s code was off the main branch I manually ported the code over for the few files that change existing brewpi files. I think I got everything, but I’m stymied as to why the code isn’t recognizing the csv for the beer, which has data being logged to it (including gravity readings). I’ve tried starting a new brew to no avail.
Any pointers or ideas would be helpful.
@baseline: did you try starting a new brew? If you have data in the csv with and without Brewometer data then the graph won’t draw because there are more columns than data for some of the data points. Once I started a new beer, everything worked fine. (Edit: I see you did try starting a new beer)
If you see the Brewometer data in the csv file, it’s probably working properly.
Did you change the brewpiJson.py file too?
I have tired a new brew. Here is a screen shot of csv:
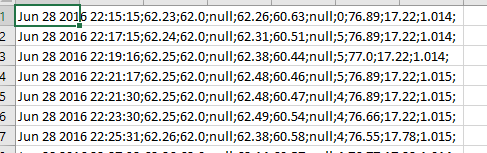
It looks like the gravity reading is there. I’ve double checked the changes I made to the script files and diff checker seems to suggest I got everything, but I might be missing something.
I’ve tried to focus on why the code thinks something wrong. I’ve located the code that throws the exception, its in
beer-chart.js around line 345.
$.post("get_beer_data.php", {"beername": beerToDraw}, function(answer) {
    var combinedJson = {};
  try{
        combinedJson = $.parseJSON(answer);
    } catch (e) {
        var $errorMessage = $("<span class='chart-error-text'>Could not parse data for this brew.<br>" +
            "If you just started this brew, click the refresh button after a few minutes.<br> " +
            "A chart will appear after the first data point is logged.</span>");
        var $refreshButton = $("<button class='chart-error-refresh'>Refresh</button>");
        $refreshButton.button({icons: {primary: "ui-icon-refresh" }}).click(function(){
            drawBeerChart(beerToDraw, div);
        });
The javascript and php code is beyond my depth. I’m trying to reading up on this but still at a loss. Something is wrong between get_beer_data.php and beer-chart.js. Any guidance folks might have would be much appreciated. In the meanwhile I’ll be slogging through tutorials.
What is the error message you are getting?
I finally ran down my issue, I was missing a critical comma, and not looking closely enough at the diffchecker. Up and working. This is awesome!
Howdy @lpgeek, This appears to be the accuracy of the brewometer - I also get the 0.5C jumps. The quoted accuracy is +/- 1C