Ha @basline - Your graph points out a bug/mistake on my behalf… Thinking that everyone was using Celsius. I’ll look at fixing both the graph and having it as a configuration file setting for the logging.
Great that you were able to get it working on your Arduino.
Just looking at the raw Brewometer output, the 0.5C jumps are due to the Fahrenheit conversion. The Brewometers output the temperature in F with no decimals (i.e 68F). so the accuracy resolution is at most 1F, but quoted is +/- 2F. This means that the measured value should be within +/- 2F of the actual.
got through my first active fermentation capturing data… still no chamber to control the temps yet, as the ideal old freezer is seeming to elude me at the moment
@Elco - I know that you’ve got your own plans for an SG sensor. Is there any ways that this mod could be structured differently to enable it to be incorporated in the mainline?
We are working on an entire new server stack, with different data logging, different UI and different charts. I would not worry about forward compatibility now. We’ll make it easy to integrate other sensors in the new UI.
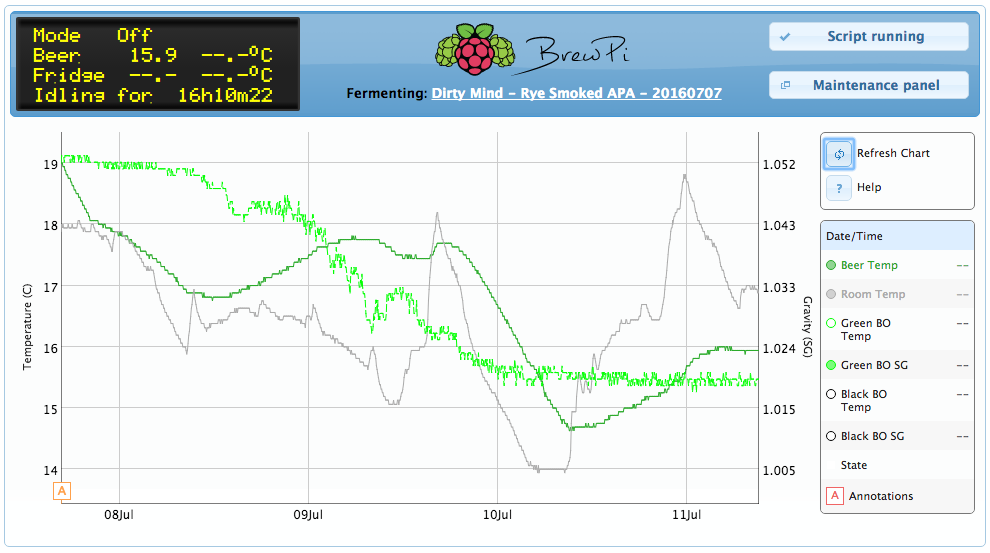
Have this installed and working. Planning to run a test batch of ginger beer and killing the fermentation at a certain gravity…awesome to see a trend of the gravity. One problem I see…the BO gravity does not zoom in properly. The secondary axis changes values, but the line seems to stay in one place vertically. (On iPad) On a computer it seems to be perfect.
I’ve observed something similar on Android. Unfortunately it’s a limitation of the graphing library.
@Elco is in the process of upgrading the frontend and I believe he is looking at a different graphing library, so we’ll see if that performs better on mobile devices.
I set this up running on a Pi 2 with Bluetooth dongle and @sbowler 's Brewometer code, great effort, thank you so much for this. The fermenter is not in my home so internet access is through a wifi 3G Dongle and password protected site.
Everything worked fine for about ten days, when the temperature / gravity graph stopped displaying on mobile devices, but it worked on my desktop.
Now after about 14 days it has stopped working on the desktop too. The lcd and header appears, the profile settings too, but no graph. I had set logging to once a minute, but maybe still too much data being generated? Anyone else experienced this and come up with a solution?
I think what’s happening is the amount of log data being returned to the mobile devices is too much for them to handle efficiently. I’ve seen similar on my mobile devices but if I wait long enough, the graph does display. I would hazard a guess that if you left the device on for 5 mins, it would eventually display the graph. This problem is the same with your desktop. I believe if you leave it long enough, the graph should display.
The solution? @Elco’s working on a new graphing mechanism which will return less data depending on the zoom level. So when you’ve got 10+ days of log data, it would only return the ‘highlights’ over the 10 days, until you zoom in on a day… Currently you will get every single datapoint over the 10 days returned.
Thanks for the reply!
You’re right, if I leave my desktop on for long enough, it will display, I guess on my phone the screen switches off before I get that far.
In any case I am very impressed with what Elco has done, as well as with the community integrating new products like the Brewometer into the software and actually sharing their efforts with the rest of us.
Beautiful work! I’m really impressed and thankful of the efforts that everyone has invested to incorporate the brewometer into the BrewPi (which in itself is amazing too).
So please pardon my newbie question, but I’ve been trying to set everything up, using just the Raspberry Pi, without the Spark or Arduino, to simply monitor my Brewometer. My question is, can the BrewPi be run without a spark or arduino (essentially without the fermentation temperature sensors and controllers) to just use it for it’s web server and graph features?
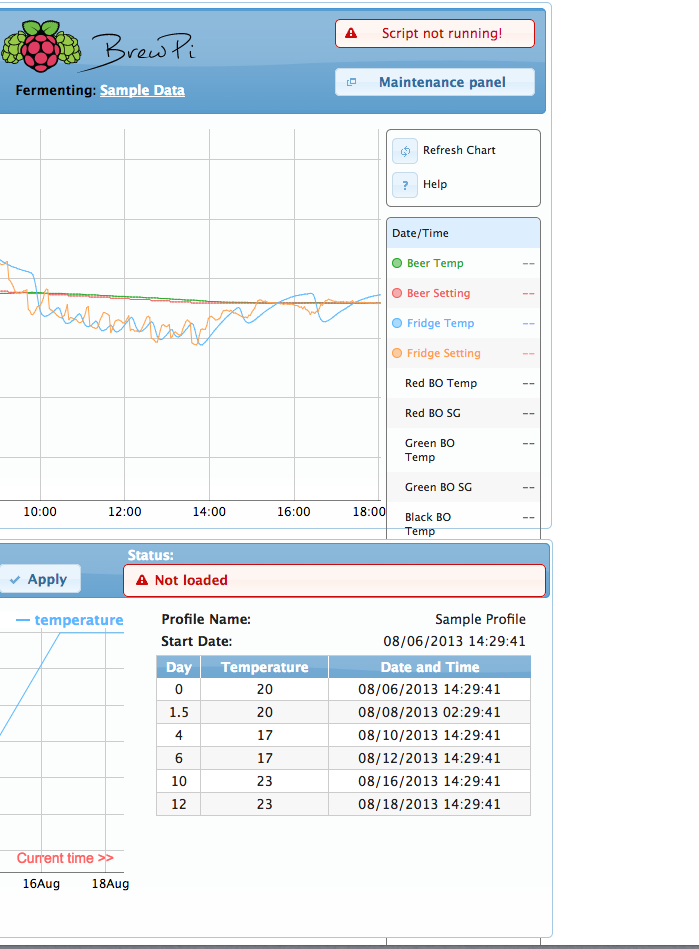
So far whenever I run the BrewPi Software, and access the WebGUI, it tells me the script is not running, and that it cannot receive LCD text from the python script. It appears that the brewpi.py script automatically checks for serial connections and stops if it finds no compatible devices.
Is there a way to get around this, so that I can still use the BrewPi WebGUI for my Brewometer, without the serial devices, until I get around to adding or buying that hardware further up the road?
Just got referred to this thread from a different discussion - I’ve done some work with Elco on building previous BrewPi mods. I was curious if you would be interested in working with me to convert this to a module that can be included with BrewPi, similar to how we do the wifichecker right now? Basically, just a config setting that, if enabled, loads up and enables your code.
I know Elco has most of his time dedicated to the new architecture, but I think there is some value to be gained from something like this in the meantime while we wait for that new architecture to come out. Any integration issues we encounter would certainly serve as lessons learned to make sure the new architecture is accommodating. Let me know if you’re interested, thanks!
The Brewometer logging is done only through the PI, so from a hardware perspective you should be right. However, we do use the logging mechanism built into the brewpi script (brewpi.py). So if that is unable to run without a Spark/Arduino attached, then we’re in a bit of trouble. I haven’t done any investigation into the script to see if the script could be modified to work without a connected device.
My advice would be to go through the brewpi.py python code and try disabling any lines that look like they exit if the connection to the Spark is lost.
Hi @sbowler thanks for writing this integration i ordered myself a brewometer of the back of seeing this thread. It arrived yesterday and i have been messing around with the integration today. I’ve managed to get it almost working but i have now modified so many things i think that i will start from scratch. This is the first time that i’ve used git hub so apologies if this is a daft question but can i just use the green ‘Clone or Download’ tab then copy the https link and then use git clone https://github.com/sibowler/brewpi-brewometer.git ? If so which directory do i direct it to?
Will i still need to apt-get python-scipy and python-numpy? I tried earlier but it says that it is an invalid operation:
I’ve got lost trying to get rid of unwanted brewometers from the web interface so that mine, yellow, isn’t hidden behind the fermentation profile by deleting lines of script which i possibly should not have done…