Well, neither one of those changes worked, even after rebooting and starting new brews. The brewpi.py file didn’t change the Tilt from displaying C. And the beer-chart.js completely removed the Tilt stats as well as the buttons to turn it off and on, but did keep the Gravity scale on the right.
@jhenry, I had the same symptoms until I cleared my browser history. I’m on the legacy branch and found the tilt temp units in /home/brewpi/brewometer/settings.ini.
There is no settings.ini file in that folder on the Legacy branch (for clarity, I am running jlvnyc’s version). Perhaps you are running sbowler’s on the Legacy brewpi branch? I couldn’t get that to work properly.
I think I got it working: I misread something in this post and had the parenthesis wrong, and when I retried that, my Tilt is now reading ºF on my chart.
When I do the test (BrewometerTest.py), it still outputs ºC since there is no settings.ini file to fix it there. (for which isn’t the Tilt putting out ºF natively? why am I seeing ºC at all?)
And, with good news to report, after a few reboots and starting yet another test beer, after replacing the beer-chart.js file with your latest, my Y-axis is reporting ºF as well, and hopefully, the refresh code you updated will lead to faster page drawing.
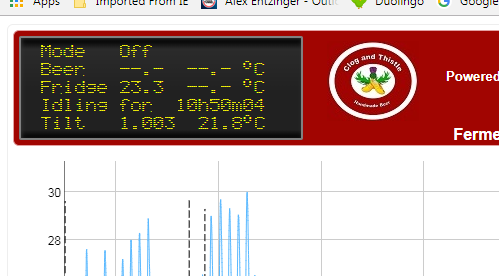
I want to be able to see an instantaneous reading from the Tilt without having to refresh the graph and hover the mouse over the graph, so made a few simple changes.
Firstly, I added an extra row to the LCD pane on the main screen (oh and also did some customization to match my brewery colours), by adding an extra element to the lcd section of beer-panel.php.
Next I added a line to the function refreshLcd in main.js that populates the screen with data.
Lastly, I modified BrewPi.py to send the extra data to the frontend. I added an extra Variable:
Yes, I’m running sbowler’s code. I had no trouble getting it to work. Installed elko’s latest, changed to his legacy branch, cloned sbowler’s repo (into /home/pi), changed to his legacy branch, and ran the install script. For some reason the installer failed on the first try, so I deleted everything in /home/brewpi and /var/www/html and tried again. It’s been running now for several days, so I consider it stable.
Hi all,
I’m having a issue getting my Tilt working in brew pi.
I have the basic brewpi set up and running fine, Spark 3, Raspberry pi Zero and BrewPi running in a container.
I have cloned the code, moved html and scripts across and have the test script running and returning values no problems, all in the container.
The only differences to the readme so far is that when I went to fix the permissions I found everything owned by root and the user brewpi didn’t exist.
However trying to start the brewpi script from either the web UI or the terminal (inside the container) throws an error:
Mar 27 2018 06:40:25 Notification: Script started for beer ‘test’
Mar 27 2018 06:40:25 Connecting to controller…
Mar 27 2018 06:40:25 Opening serial port
Mar 27 2018 06:40:25 Checking software version on controller…
Traceback (most recent call last):
File “/home/brewpi/brewpi.py”, line 353, in
hwVersion = brewpiVersion.getVersionFromSerial(ser)
File “/home/brewpi/brewpiVersion.py”, line 29, in getVersionFromSerial
bg_ser.writeln(‘n’) # request version info
AttributeError: ‘Serial’ object has no attribute ‘writeln’
If I restore the original brewpi.py the script starts just fine, albeit without the Tilt showing up in the UI.
When the original brewpi.py starts up I get slightly different messages regarding serial connections:
Mar 27 2018 06:41:04 Notification: Script started for beer ‘test’
Mar 27 2018 06:41:04 Connecting to controller… Mar 27 2018 06:41:04 Background thread for serial started Mar 27 2018 06:41:04 Serial (re)connected at port: socket://192.168.1.144:6666
Mar 27 2018 06:41:06 Found BrewPi v0.5.4 build 0.5.4-0-gb18a0ebdf, running on a Particle p1 with a V3 shield
I’m assuming the modified brewpi.py script for the tilt is a bit too different from the original and is causing compatibility issues, but just checking if anyone else has encountered this?
In the mean time I’m running a few tests on my setup and everything else seems to be working fine. Just got to decide what I’m going to brew first now!
Cheers.
Hi @eviltom - Before you updated, are you sure you were on the latest version of BrewPi? I compared my modifications to source, and they shouldn’t have resulted in different log messages as you have above… i.e. the “Opening serial port” is a standard message in the setupSerial function which is part of the original script, so should be present in both your logs.
Can you check what version you’re running pre-mod?
Hi @sbowler
Thanks for the reply.
I think I’m up to date.
I have recreated the container with ‘Pull latest image’ ticked, then run the updater script which gives me
*** Updating BrewPi script repository ***
Stopping running instances of BrewPi
Quit message sent to BrewPi instance with pid 58!
You are on branch master
The latest commit in /home/brewpi is 00957ff58df74a82e0d25420d006c26c08cb3950 on Sun, 18 Mar 2018 14:05:21
The latest commit on origin/master is 00957ff58df74a82e0d25420d006c26c08cb3950 on Sun, 18 Mar 2018 14:05:21
Your local version of /home/brewpi is up to date!
*** Updating BrewPi web interface repository ***
You are on branch master
The latest commit in /var/www/html is 8a52496877d30a18f2ff7494e64222389fdafb2a on Mon, 12 Mar 2018 15:53:26
The latest commit on origin/master is 8a52496877d30a18f2ff7494e64222389fdafb2a on Mon, 12 Mar 2018 15:53:26
Your local version of /var/www/html is up to date!
If I then follow the instructions in the Readme I end up with the same error
Is there something I’m missing?
I was hoping for help with this error I can’t get past during first steps of @sbowler github install steps. below is the command then error. How can i get past this? Thank you.
pi@raspberrypi:~ $ pi@raspberrypi:~ $ sudo apt-get install bluez python-bluez python-scipy python-numpy libcap2-bin
Reading package lists… Done
Building dependency tree
Reading state information… Done
bluez is already the newest version (5.43-2+rpt2+deb9u2).
bluez set to manually installed.
libcap2-bin is already the newest version (1:2.25-1).
python-numpy is already the newest version (1:1.12.1-3).
python-numpy set to manually installed.
Some packages could not be installed. This may mean that you have
requested an impossible situation or if you are using the unstable
distribution that some required packages have not yet been created
or been moved out of Incoming.
The following information may help to resolve the situation:
The following packages have unmet dependencies:
python-scipy : Depends: libstdc++6 (>= 4.3.0) but it is not going to be installed
Recommends: g++ but it is not going to be installed or
c+±compiler
As I continue the listed commands I get another error on:
pi@raspberrypi:~ $ python BrewometerTest.py
python: can’t open file ‘BrewometerTest.py’: [Errno 2] No such file or directory
My problem is with this command. Is there anyway to correct it? Why am I having this error on my system?
pi@raspberrypi:~ $ sudo apt-get install python-scipy
Reading package lists… Done
Building dependency tree
Reading state information… Done
Some packages could not be installed. This may mean that you have
requested an impossible situation or if you are using the unstable
distribution that some required packages have not yet been created
or been moved out of Incoming.
The following information may help to resolve the situation:
The following packages have unmet dependencies:
python-scipy : Depends: libstdc++6 (>= 4.3.0) but it is not going to be installed
Recommends: g++ but it is not going to be installed or
c+±compiler
E: Unable to correct problems, you have held broken packages.