I am working on estimating process parameters. For this reason I download graph data as a .csv. I think you have made a most wonderful flexible system here!
I see that the sampling interval seems to be fixed at 60s. I have not found a way of altering it.
Have I overlooked something here?
Do you have any plans on your ToDo for making the sampling time selectable?
I might also ask if you have a LP filter here for preserving the Nyquist criterion or have you just picked the samples?
I must add that this is not a critical issue for me, but a nice to have.
Graph data CSV exports use an averaged 60s interval. Sample rate for the Spark service is ~5s, but that data is only kept for 24h.
If you want more detailed access to the underlying data, you can also check this topic.
Regarding your question about the Nyquist frequency: in the database, the data of each interval is simply averaged to give the downsampled result. It is not sampled from a higher frequency set, it is just a running average.
Most blocks are updated every second, but the data is logged every 5 seconds. In theory, there could be a very small amount of aliasing here, but it is unlikely given how fast they change.
The filters on the Spark for the sensors/PID are of course designed to have no aliasing when they are downsampled. It’s a cascaded butterworth filter and the amount of cascades depends on the filter choice. It is designed to have maximal flatness and minimal quantization noise.
So the input to the PID is filtered depending on the filter choice, and the output is calculated from this filtered input.
Thank you Bob and Elco,
I agree, aliasing problems are not likely, the process time constants taken into account. The only source could be measurement noise, I guess this is close to academic.
Now let us see how much I understand.
Data is logged every 5 sec, These data are stored for 24h. What are these data used for? Thinking that a fermentation process may last 3 weeks.
We have a data log for each 60 sec. For how long is this stored? Where is it stored?
Will all parameters be stored regardless of what was chosen for graphing during the process run? If so, I can go back in time and select whatever data combination I would like.
We use an InfluxDB database for storage, and the brewblox-history service as API / event listener.
Data is stored on disk in the brewblox/influx directory.
Anyone can publish to the history service, at any interval they want. The Spark happens to use a 5s interval, but I’ve also seen services with a 15m interval.
The Influx database is configured to progressively downsample data using continuous queries.
- incoming data is placed in the
autogendataset - every 1m, data pushed during the last 1m is averaged, and placed in the
downsample_1mdataset. - every 10m, data is collected from
downsample_1mand placed indownsample_10m - same for
downsample_1handdownsample_6h: insert average value from previous dataset every period.
The autogen data is kept for 24h to conserve disk space. All others are kept infinitely.
When the UI requests data for a graph, the most appropriate downsample dataset is selected as source. This is based on how many points would be yielded for the requested fields / period.
If you want to graph the last 10m, you get autogen data. If you want the last month, you’ll likely get downsample_1h. If you hover over an icon in the period selector in graph widget settings, it shows you currently used dataset(s).
Data requested by the UI does not impact which data fields are retained.
In the UI graph settings, only fields with a presence in autogen (== have pushed data last 24h) are shown.
CSV output always uses 1m, because it’s the highest resolution dataset with infinite retention.
Thanks again,
Sometimes I feel I need to be feeded with a teaspoon.  .
.
Have I understood correctly? I can set up a graph, go back in time as far as I want, select my time interval, select any combination of data and download a .csv file with 60s sample time? If so: marvelous!
Yes, that’s correct. Enjoy!
I am doing step response in the HLT kettle. I set a step value > 100/k so that I would be nonlinear (PWM = 100) in the beginning. When it got to where it should go linear (PWM < 100) indicated PWM dropped to about 50 but the heater was doing 100. I s there a log file I could send you?
I suspect that’s caused by either the PWM cycle setting, or a minimum ON constraint, depending on your configuration.
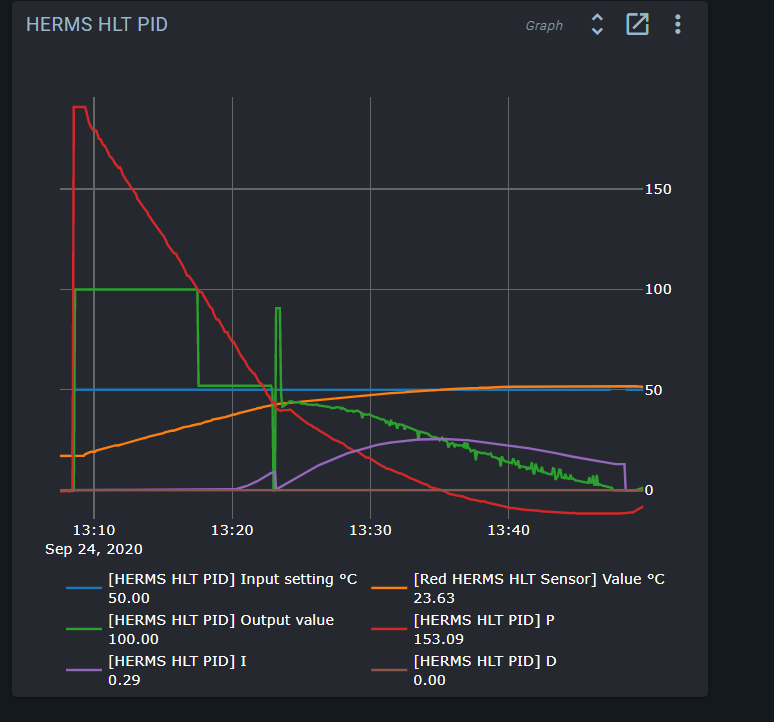
You can check the PID block graph to see the settings parts, and the PWM block to see if any constraints are active.
I can not see anything wrong. At about 13:15 PWM dropped to app. 50 while the output to heater was 100.

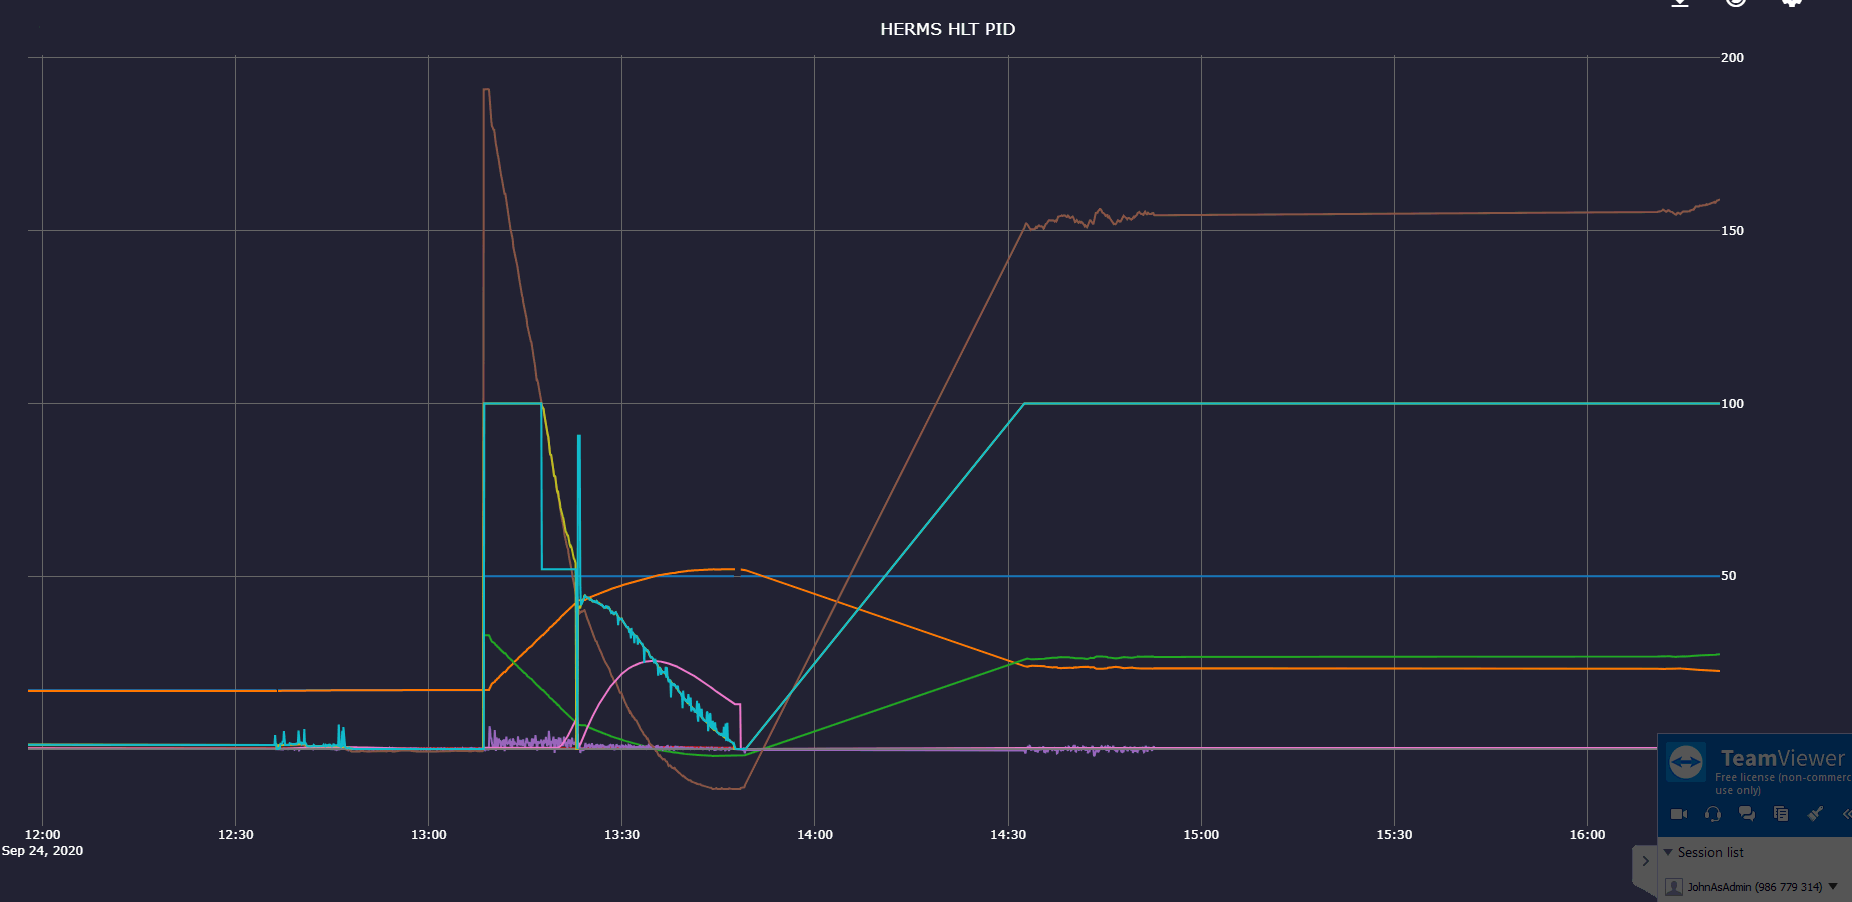
Can you show the graph of the PID, the one that can slide out if you open de popup of the block?
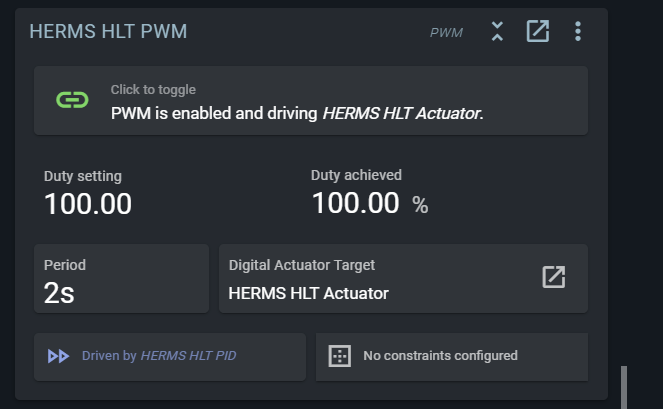
And perhaps that of the PWM block and the target of the PWM block?
It might be a glitch in how the achieved value of the PWM is calculated.

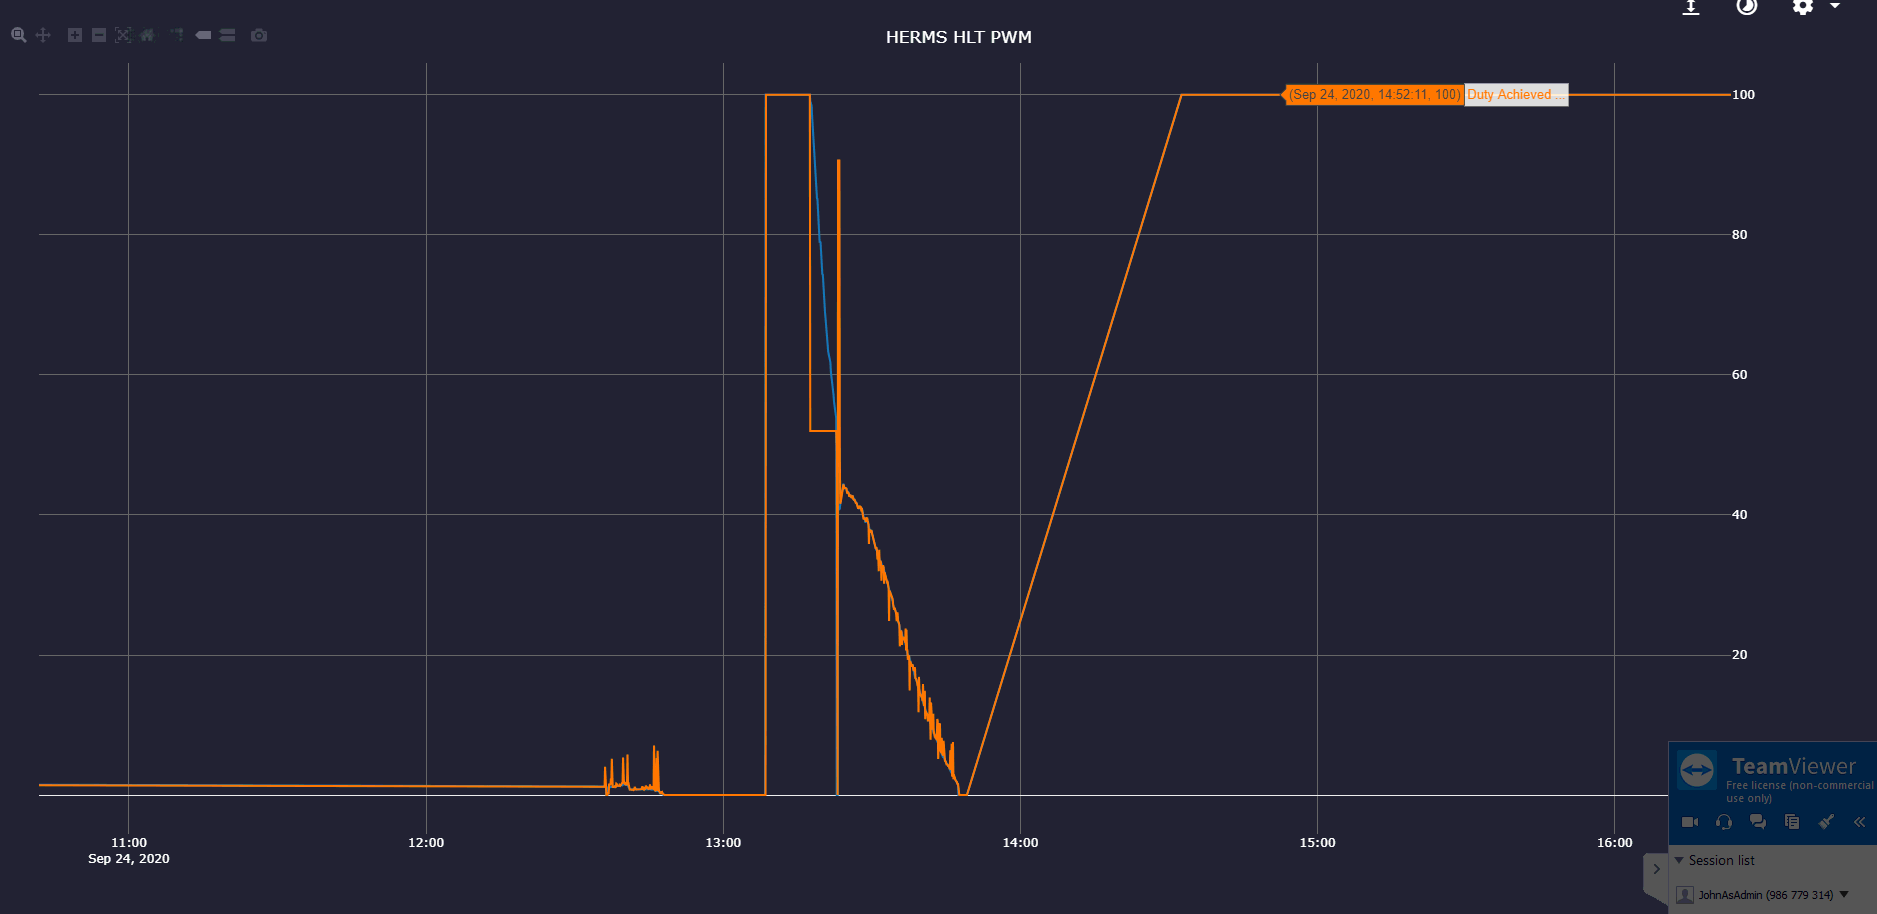
Could you please include the legend? You can also click and drag on the graph to narrow the period.
I see. To calculate the value, the last 5 toggles are remembered.
It was off for a long time, then on for a long time and then started toggling. When it toggled and discarded the long low period, it looked was ON for a long time.
The near 100% comes from (for example):
ON for 10m
OFF for 1s
ON for 1s
OFF for 1s
Is this with a recent firmware? If so, I should look again at the maximum of time in the past that is taken into account.
I have the firmware update 31/08/2020.
Should I install the latest firmware?
Are you asking me to check something, is the ball in my half of the field?
No, I know enough. There most recent version did not have changes to PWM handling, so it will not fix this issue. Upgrading is still recommend of course.
I have done brewblox-ctl update, pressed update on the blue button and then 2 x brewblox-ctl update. Where can I go from here?
brewblox-ctl flash stops your services. Have you started them again with brewblox-ctl up?
Yes, no success. …
What is or isn’t happening? Could you please run brewblox-ctl log?