A feature that I would like to propose would be a widget, or an enhancement of the existing metrics widget that displayed statistics calculated from sensor readings within a defined period.
My use case:
My fermentation chamber was poorly thought out and is a bit under powered to consistently moderate vigorous fermentations at lager yeast temperatures. As a result, I like to keep an eye on the duty cycle (eg. period of function defined by fridge chamber sensor values) of the mini-fridge compressor and as well as the mean value and variation between highs and lows (eg. central tendency and amplitude of this function). If I see any of these characteristics suggesting that the system is overloaded, I may manually intervene by adding ice packs to the fridge chamber.
What I do currently:
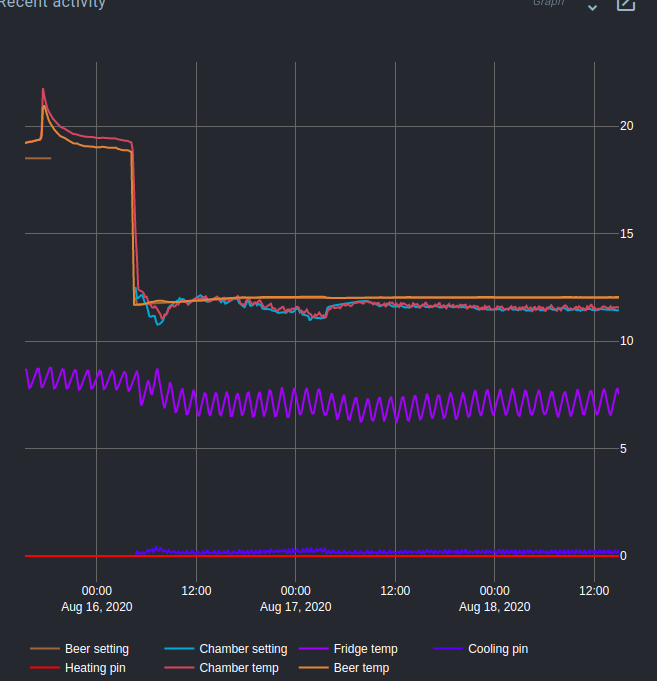
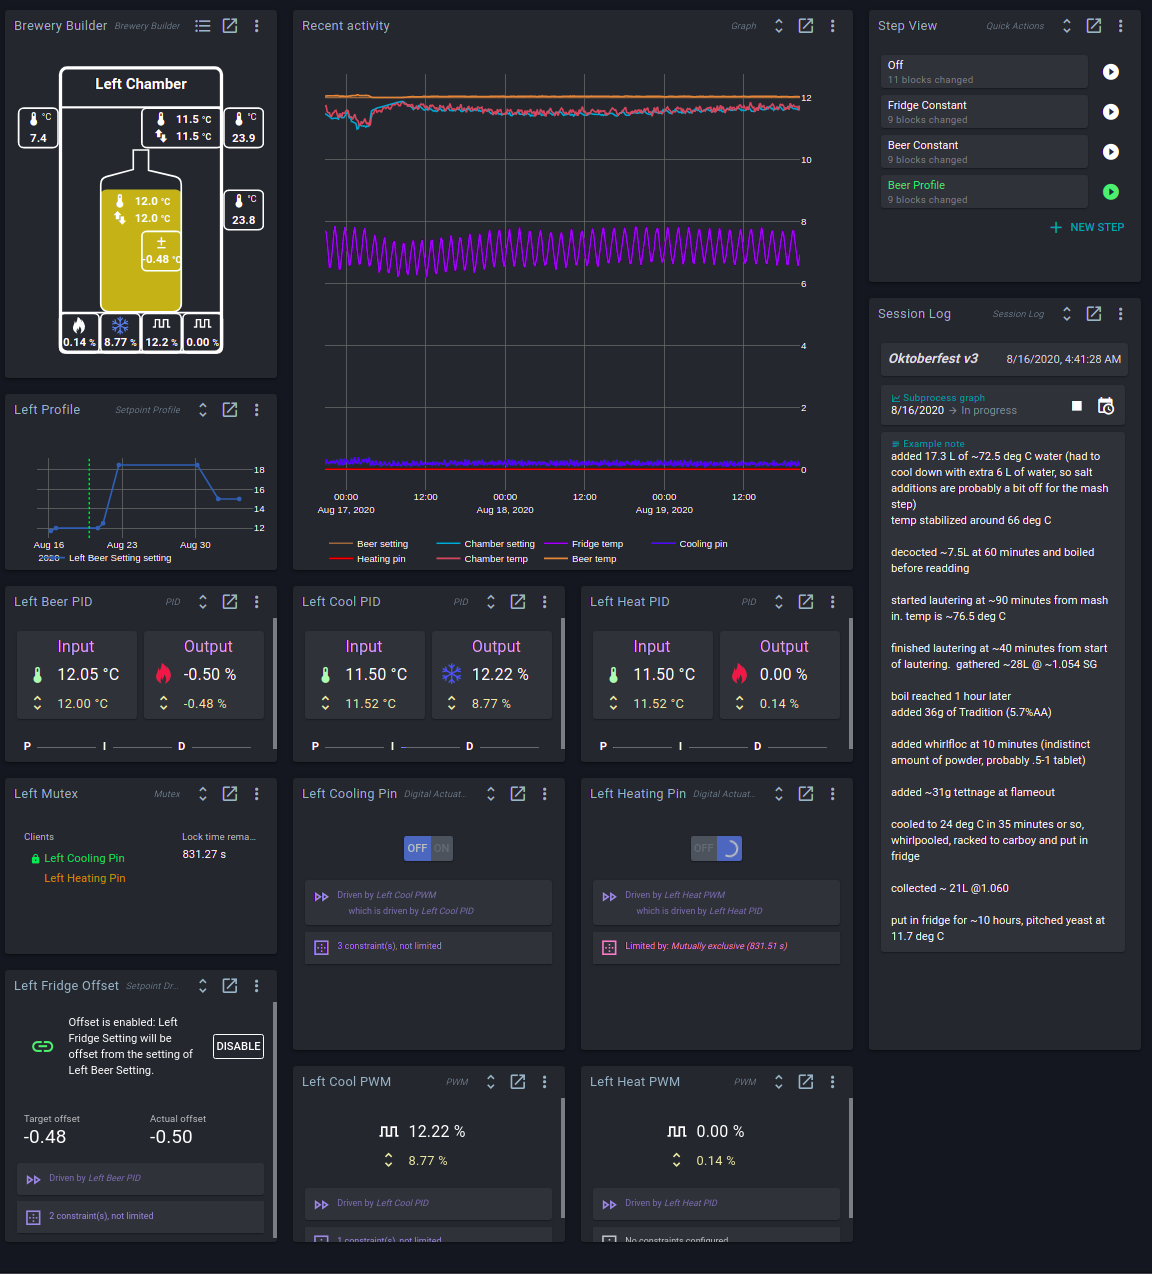
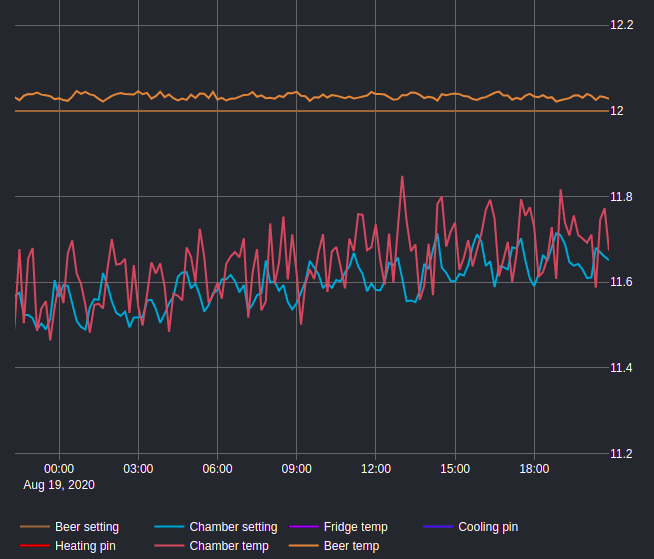
I mouse over values from the fridge sensor in the recent activity graph (the purple line) and manually estimate the characteristics I’m interested in (and or just eyeball whether there is a problem).
What I’d like to do:
Have a widget to calculate and display statistics calculated based on recent data from a database query. For example, one simple statistic might be the range (max-min) of fridge sensor values from the past 6 hours. A statistic for duty cycle may be a little more involved to calculate and display but would be useful. I’m imagining configuration being somewhat similar to how the logic actuator widget allows users to define their own conditions based on available parts. An extension would be to combine with a logic block to define alarms if these calculated statistics exceed certain parameters.
Getting the desired data is relatively trivial: min/max/mean/average of points over a duration are built-in functions for the database.
UI integration is a bit more work. It’s probably best implemented in the metrics widget - if I understand you correctly, you want a single result, not a historic running average.
Triggers would fall under the purview of the automation service. The logic actuator lives on the Spark service, and does not have access to history data.
If a min/max/etc value is added to the history API, then an automation condition could query it and check output value.
I’ll put the relevant issues on the backlog, and we’ll do some prioritization when Elco is back.
Thanks for the quick response. This isn’t especially urgent, it’s more of an idea that just occurred to me, but seems like it could be valuable for a lot of cases beyond just my poorly designed system.
if I understand you correctly, you want a single result, not a historic running average.
I think what I’ve got in mind is a periodically updated statistic calculated on data from user defined duration (e.g. 3 hours) going backwards from the present. After reviewing the documentation, I think the InfluxDB CONTINUOUS QUERY functionality is pretty close to what I have in mind (but have the metrics widget display the most recent value from that continuous query).
I agree that it looks like the InfluxDB built in functions should cover a lot of what I’m looking for. It’s not immediately apparent how to calculate the duty cycle period with them, but this may just be a lack of creativity on my part as most of the fundamentals appear to be there, I’m just not familiar with how to combine them into a single query.
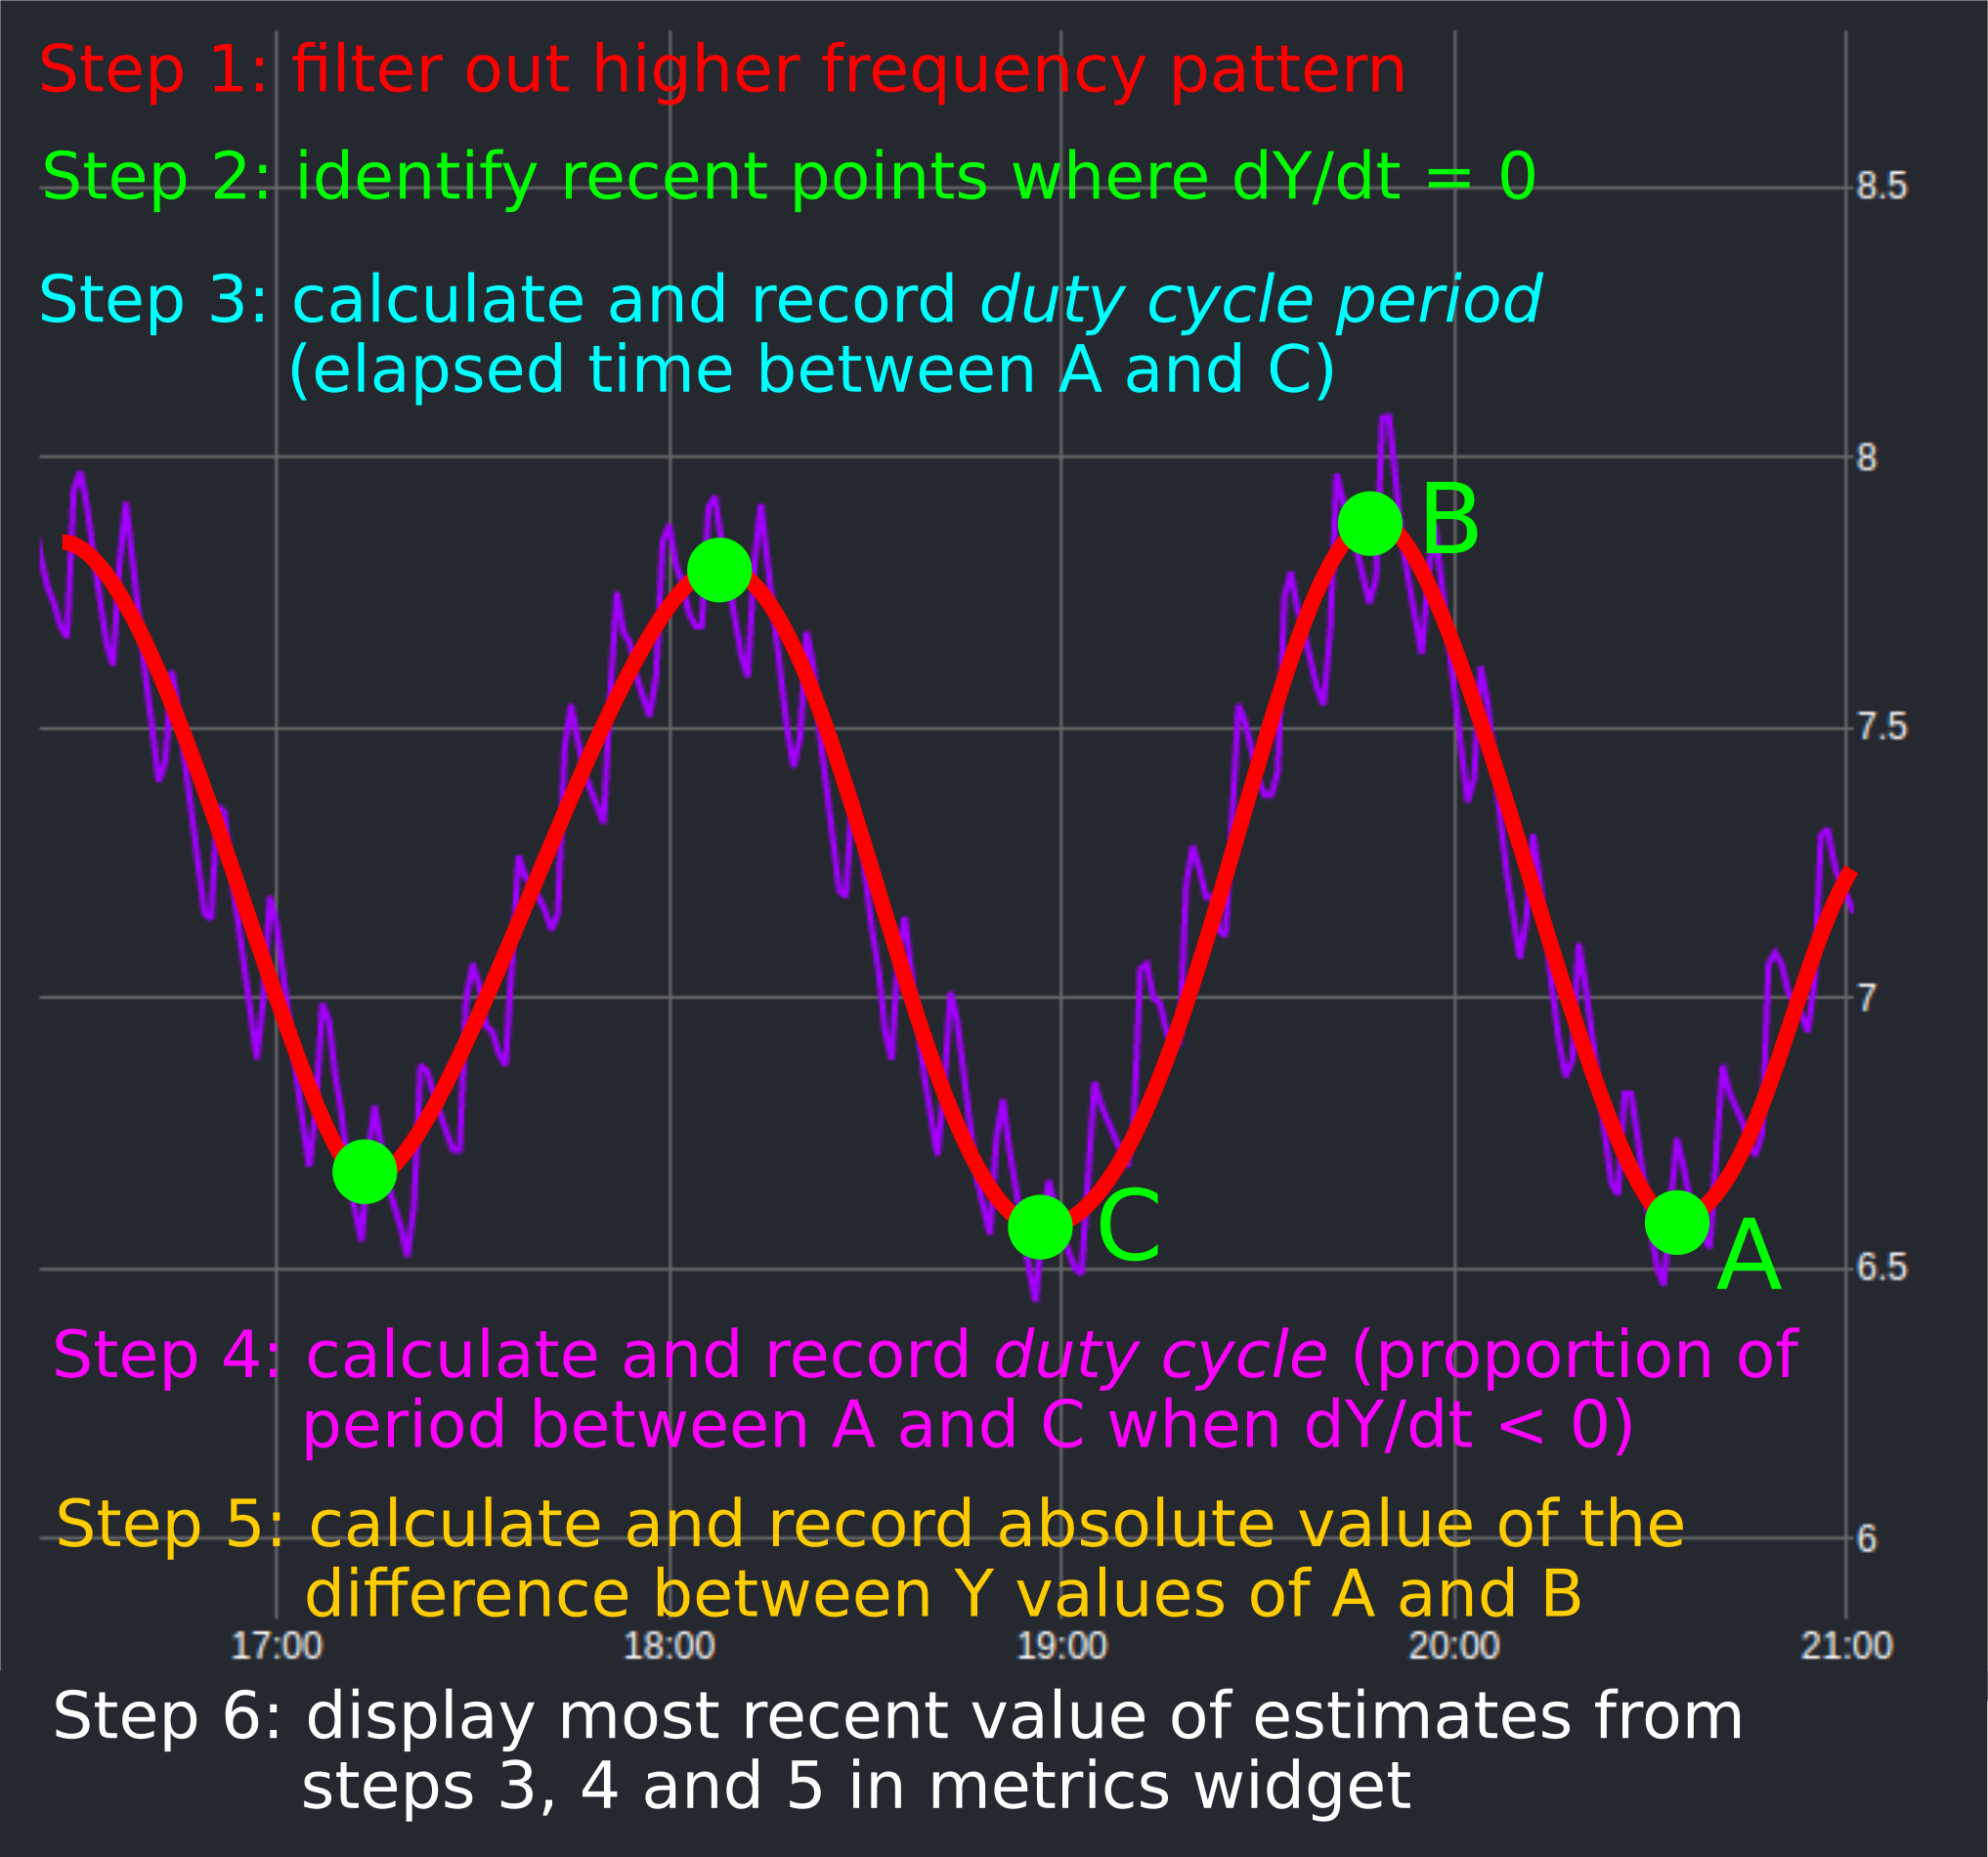
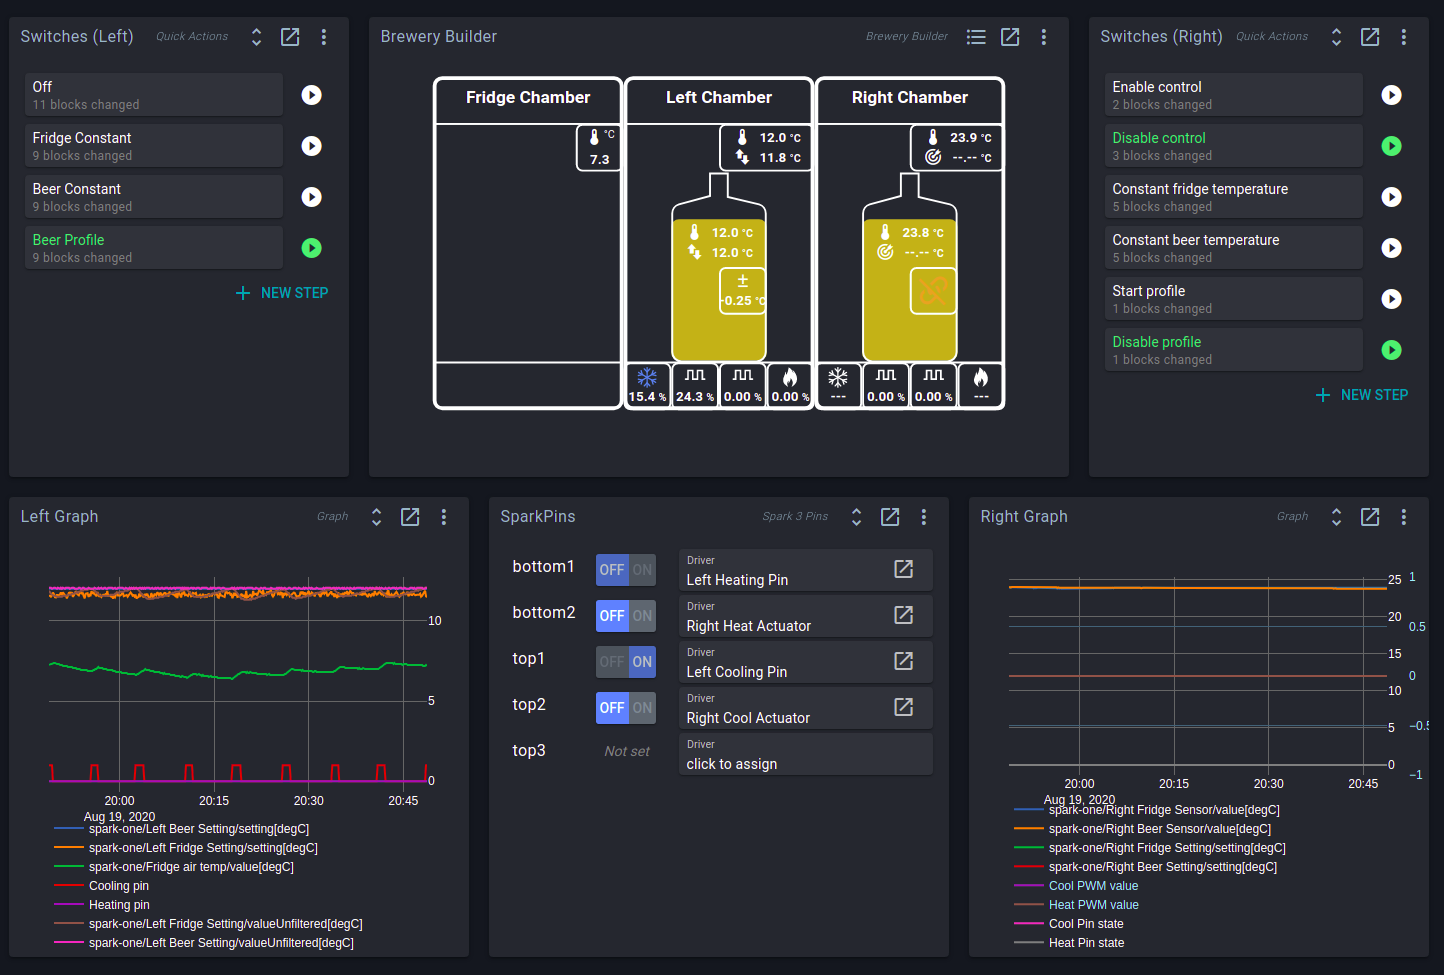
I realized I was being a bit sloppy with language earlier and that an annotated screenshot and a more generic use case might give a better idea of what I’m imagining.
A more generic explanation of the use case (as mine is pretty unique) is that BrewBlox is often controlling a process that eventually transfers heat to/from an environment that it can monitor but cannot directly control. A more common example might be one where Brewblox controls a glycol pump, but the glycol chiller’s built in controller controls the compressor that is chilling the glycol in the reservoir. Brewblox can use maximum duty cycle/on-time/off-time constraints to avoid exceeding the performance capabilities of the parts in the process it controls (e.g. the glycol pump), but it can only monitor the performance of the external processes (e.g. the glycol chiller).
My idea for “advanced metrics” would be to calculate some relevant performance statistics for processes that BrewBlox can monitor but not control and display them on the dashboard so the user can easily keep track of them and react accordingly. An extension would be to define conditions which would trigger alerts, or potentially use the forthcoming automation functionality to have BrewBlox change the behavior of the process it controls if it detects that the external process is performing abnormally or approaching a performance threshold.
It seems like the built in InfluxDB functions contain all the fundamental elements to accomplish what I’m imagining, but I can’t figure out what the correct syntax would be (or if it’s even possible) to accomplish steps 3/4/5 with single query.
Correct. This would also make data available for consumption by both the graph and metrics widgets.
A practical consideration is that Influx is moving to a new query language Flux, which has Tasks as a comparable-but-not-equal alternative to continuous queries.
We’re migrating to Flux when it’s sufficiently stable, mostly to get rid of some ugly hacks required by us using continuous queries to downsample history data.
Your use case would not suffer from the problem with continuous queries, but we’d rather avoid implementing an API we have to migrate almost immediately.
I can still work the required syntax for you to manually add a query. Once the data is written, it can be used by the existing graph / metrics widgets.
Conclusions:
Showing metrics / history with some math function applied is a useful feature.
“get PW / f / T / duty cycle for largest sine wave in period” is a common enough use case to make it worth adding to the list of available functions.
Continuous queries / tasks are a good place to implement said math functions, but we’ll implement that after the switch to Flux.
If you add your own continuous query to Influx, you can show its output in graph / metrics.
I’ll have a look at calculations / syntax for creating said query.
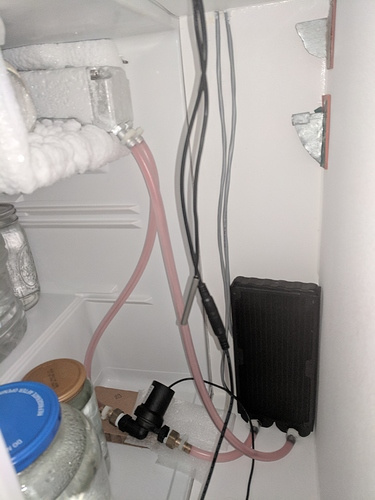
Yes, it’s a (poorly thought out) cascaded setup. That purple line is the sensor in the coldest chamber, which has blower fans that blow cold air through ducts to the fermentation chambers. The period for the PWM controlling the fans is 10m with a max duty of 60%. I was trying to replicate how two compartment fridge/freezer combos work, but using blown air as the medium for transferring heat is incredibly inefficient and the mini-fridge is a bit under powered to make up for that inefficiency.
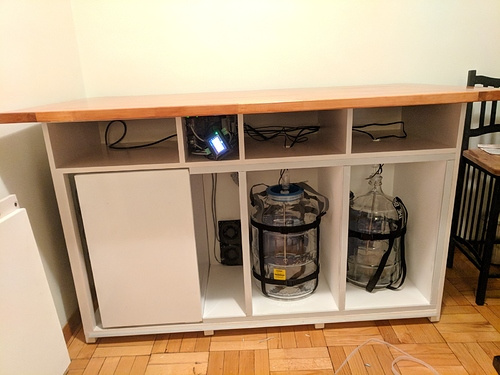
I eventually installed a mini-glycol system in the cold chamber to transfer heat from the evaporator to the blower fans, which made the system much more efficient. The smarter move (and an eventual upgrade) would have been to put chiller coils and fans in the fermentation chambers and run the glycol lines through the ducts to them.
Despite it’s design flaws, the system actually works really well for regulating the beer temperatures (easily keeps it within 0.1 deg C) so I’m not particularly concerned about tuning the Spark PIDs. It’s just that when I try fermenting lagers, occasionally the mini fridge chilling the coldest chamber seems to get overwhelmed and losses control of the process (sometimes it slowly losses control, other times I suspect the compressor overheats and just suddenly shuts off). This doesn’t happen particularly often, but is destructive when it does (especially due to condensation/melting issues) so I like to be able to foresee and avert any potential problems. I’d also just like to monitor the health of the mini-fridge compressor over time to have some warning before it dies (it’s probably ~12 years old).
Like I said, my case is pretty unique and largely due to some poor design choices, but I realized my idea for how to monitor the situation until I eventually upgrade the system is probably relevant to a number of more common use cases.
That sounds wise.
If it’s easy enough to expose a field that allows me to play around with manually defined queries, I would appreciate it. But I certainly wouldn’t want this to detract from other development work.
You can use the built-in InfluxDB tooling, or connect a graphical application like Chronograf to tinker with data and continuous queries.
To access the Influx CLI, run
As long as you store data in the brewblox database, it’s compatible with our tooling.
A measurement is the equivalent of a table in a relational database, or a sheet in excel.
We store data for a single service in a single measurement. If you have two spark services, they will both have their own measurement. New measurements you create will automatically show up in the UI.
I’d recommend storing output data in a new measurement, so you can easily wipe it a few times while tuning your query.
With this as context:
Fetch data from a measurement with service name in the brewblox database
Write data to a new measurement in the brewblox database
Example query:
CREATE CONTINUOUS QUERY cq_example ON brewblox
BEGIN
    SELECT mean("field/value[degF]") as "output_value[degF]", mean("field/setting[degF") as "output_setting[degF]"
    INTO processed
    FROM "spark-one"
    GROUP BY time(1m), *
END;
processed is an example name for your output measurement. You do not need to explicitly create it.
I formatted the query with newlines / indents for readability, but that’s not required.
You can run show continuous queries to see the ones we added.
Thanks for the insights in your setup, that really helps to understand how it behaves.
Some general things to keep in mind:
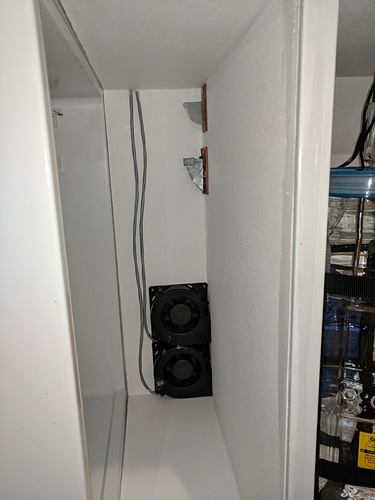
Ice is a great insulator. Try to prevent ice build-up and add a defrost cycle if you can.
For the beer PIDs, use a Ti of at least 6 hours to prevent any oscillating behavior of the integrator. If you think this makes it respond too slowly, you should increase Kp, not Ti.
I think both approaches would work here:
Each beer has only 1 PID for cooling, driven directly by beer temp, which drives the fan of the chamber.
Each beer chamber has a PID maintaining chamber temp, of which the setpoint is driven by a PID based on beer temp.
The first approach is probably easier to understand and tune. In both cases though, the beer PID should have a large Ti, 6-12h. With fairly recent changes to the PID algorithm, increasing Td might help a bit too reduce overshoot too. It can also prevent integral windup a bit.
Without looking at the PID internal graphs, it’s hard to tell. But if your integral (I-part) is fluctuating too much, you should try to make some changes.
You can probably also run the fans on fast PWM (100Hz), instead of ON/OFF, for speed control. It might also be best to limit their max duty cycle to 10 or 20%. If that’s enough to move the cold air from fridge to chamber at a rate the fridge an keep up with, any extra flow is just heating.
Thanks a ton, this is perfect. I didn’t realize the Influx CLI was already built into the brewblox installation. I’ll need to spend some time reviewing their documentation, but this seems to be everything I need.
After I’m able to fine tune my continuous queries using the CLI and/or Chronograf I’m assuming the new measurement with the new field keys from my continuous query(s) will show up below the “spark-one” measurement in the BrewBlox graph and metrics widgets?
This describes how it is currently configured. Or at least the chamber I use (“left chamber”) . The second chamber was set up using the more modern single “direct drive” PID from the wizard, but I don’t use that chamber currently and can’t remember whether I ever test/tuned it after running the wizard.
That picture is from a couple years ago. After my most recent manual defrosting I started periodically cycling satchels of silica gel beads in/out of that chamber which seems to have helped a lot, but a defrost cycle would no doubt help even more.
If I get another relay and let the spark/BrewBlox control the fridge compressor, is there an easy way to implement a defrost cycle? Is there a way to define an automatically repeating set point profile? When I first set this system up, BrewBlox was still a long way from public beta and I didn’t have multiple-process control, so I never really thought about adding in another relay for the fridge compressor. Given that I’ve been using BrewBlox (which I love) for a while now, it seems like that may be a good upgrade, especially if it allows me to implement a defrost cycle.
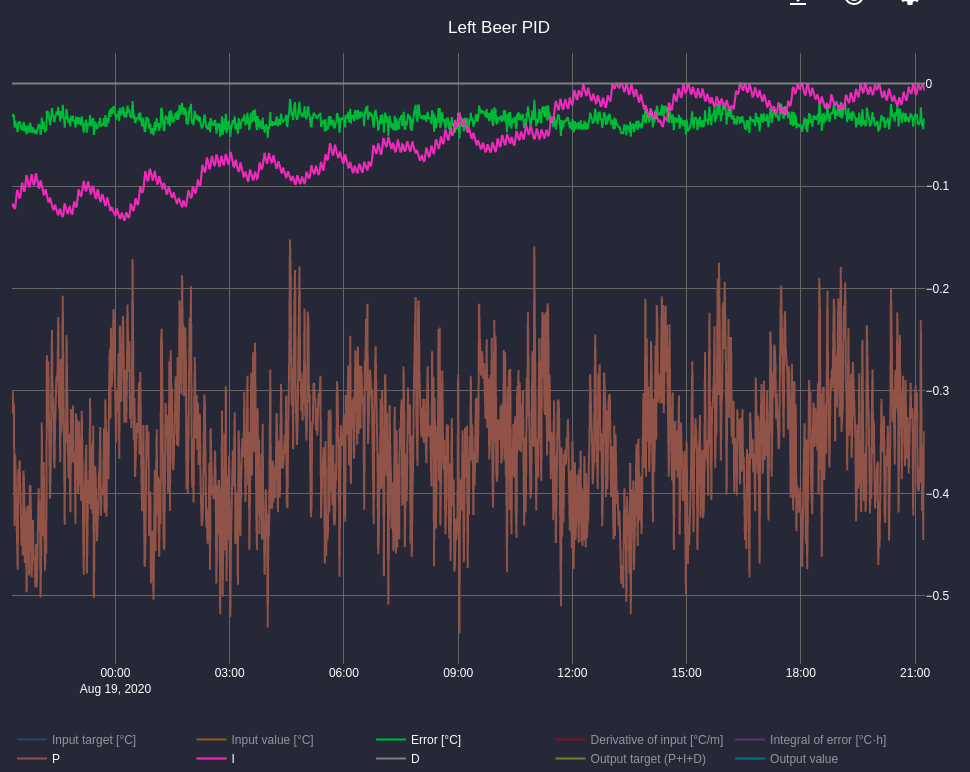
I haven’t spent a lot of time fine-tuning the PIDs as the oscillation that makes it through to the beer temperature is very small (between 12.02 and 12.05). That said, the integrator (pink) in both PIDs does seem to oscillate according to both the ~1 hour mini-fridge duty cycle and the 10m fan slow PWM cycle. I never considered this a problem and thought it was just an unavoidable consequence of my hardware. Your suggestion is that I should lengthen Ti to completely filter out those two cycles and then let the proportional component deal with error resulting from those cycles?
This is a really interesting suggestion. Using fast PWM would completely eliminate the higher freq. oscillation from the current slow PWM cycle. If I remember correctly, when I was setting all this up, fast PWM hadn’t been implemented yet. Can I just enter 100hz in the PWM period (instead of current value of 10m) to switch to fast mode? Or is there a separate setting/block somewhere that I am missing?
The cooling pin relay powers both the relevant blower fan and the shared glycol pump. I’m sure the blower fan would be happy with fast PWM, but I’d need to investigate whether the pump is compatible. They are both brush-less DC motors, so I guess PWM is probably okay for the pump as well.
I didn’t consider the pump also being driven by the PWM, perhaps just reducing the PWM period a bit would help too.
Td off was recommended before, but since recent changes I think it will help you.
I would try the following for the beer PID:
Ti: 6h
Td: 30m
And for the chamber PID:
Ti: 3h
Td: 10m
PWM period at 5m for now. The duty cycle is very low (5%), so with 5m, that’s only 15s. If you reduce the PWM period too much, the pump will not even pump the liquid through the heat exchanger each time it turns on.
Your P value is also very noisy/spikey. If you increase the filtering a bit in the setpoint, it will be much smoother for a more constant duty cycle.
The influx service in docker-compose runs the official InfluxDB 1.8 Docker image. You can assume most Influx-related software and documentation to be compatible.
If you need external access, you can expose the 8086 port by running:
brewblox-ctl service expose influx "8086:8086"
Yes. The list is refreshed every time you open the settings for a graph or metrics widget.
I’ve implemented the changes you recommend (including increasing the setpoint filter from 3m to 10m). Will be interesting to see how this effects things.