Monitor problems

Yes. The Pi is not involved in direct temperature control - your Spark is.
The Pi is used to change settings on the Spark, and collect history data.

Make sure the Spark is connected to a power supply, and you can tinker with the Pi without disturbing actual control.

I am running my fermentation process and it seems that BrewBlox is doing its job well.
However, there seems som be some noise here. I’m sending you some screenshots and ask your advice as to how I should go about this when my fermentation is done.

The temperature range between min/max is ~0.05*C. At that point, you’re mostly seeing random bit flips in measurements. The graphs look choppy, but in absolute terms, temperature control is dead on.

From your last graph, there does not appear to be any rubber banding either. Your system keeps turning on the heater, but never the cooler.

At a guess, you’re using a Setpoint Driver to control fridge temperature? You could switch to direct beer control to simplify the control chain, but that’s mostly preference if the current setup works just fine.

Thank you. I see there are som low-pass filters at some stages. I was wondering whether they could do with some adjustments.

The graph shows unfiltered data. If you want to see the filtered version, you could select the PID inputValue field in the graph. I believe (but am not 100% sure) that shows the measured value after filteres are applied.

The setpoint block has a filtered and unfiltered temp. I would select it from the setpoint. That’s also where you configure the amount of filtering.

Thank you. Would you like to suggest a filter setting?

Note that the resolution of the sensor is 0.0625 degrees Celsius. But you are really at the limit of the sensor precision of 16 steps per degree.

If you look at a chart with a small time span, you’ll see the bit flips. For longer periods, the time series database averages the data into sparser samples. That’s why you see fluctuations between 18.9 and 18.95. The sensor will give you 18.875 or 18.9375.
50% chance of both if the temperature is exactly between them. Your setpoint is exactly between these two. So flickering between them is actually the perfect result and we cannot do any better!

Because a filter does a weighted average of values, increasing the filtering will also introduce a delay in the measurement. The PID uses the filtered signal.

The fridge temperature is fast changing, so you don’t want to introduce too much delay. Something under 5 minutes. For the beer temperature, you can use a bit more.
More filtering gives a smoother signal at the cost of a delay in response and possible overshoot.

Try a bit more filtering, but not too much. You cannot get a tighter control than this, just prettier lines.

Hi there,
I have just finished a brew, brewed on Jan 8. bottled on Jan 29. I am now left with some questions, I will try to structure them. I refreshed the BreBlox today. Before that there has been “some time”

  1. It seems that the system did not start recording data before Jan 11. 01:00. My earlier submissions on this thread seem to indicate the same situation. In the beginning I had a logitech mouse + keyboard, thru a KVM switch, connected to a USB port on the RPi. Bob saw some Logitech problems on the USB port on around Jan. 9. I disconnected these some time in the beginning, I am not quite sure of the date. After that, the display behaved well back to Jan. 11. 01:00. Is this a known problem? Do you have any suggestions? If not, I will try going KISS and disconnect the mouse and keyboard while brewing.
  2. Bob mentioned ipv6. I have not done anything with it yet. Could this be part of my problem?
  3. When updating I get a question about Docker images. Could you please explain, in very simple terms, what this means and what are the consequences.
  4. I understand that logged data is stored on the RPi. It seems that the stored data are not accessible to me. Correct? Are these stored data only accessible to me via the BrewBlox display? This seems to be an OK solution for me. I am very interested in the sample rate. A recent .csv file has 60s I see. Do the data get decimated as time goes by? If so, what is the schedule. I understand that I can not go back a year and get a .csv file with 60s sample rate. It seems that I can go back in time and get 60s rate on the .csv file, but this level of detail does not show up on the display.
    I hope these questions make some sense and I am looking forward to your answers.

To answer, in order:

1

USB issues interfering with your connection is not a known problem. You were the first to report it, and I was unable to reproduce it here. If it works, I indeed would recommend disconnecting them, as they’re not required anyway.

2

Yes, It can be. IPv6 is of limited importance in a local network anyway, so normally we recommend running brewblox-ctl disable-ipv6. Even if it doesn’t solve the problem, it won’t hurt.

3

Docker images are like a .exe file. You start them to run the software, but they do not contain your brew data.
Downloading an updated image does not remove the old one. To reclaim disk space, we can clean up these backups of old images. This is a system-wide cleanup, so we ask first. The user may have non-brewblox images he doesn’t want cleaned up.
This is a case of “if you have to ask, always choose yes”.

4

Logged data is stored on the Pi, but nothing is secret, and there are alternatives to using the Brewblox UI. You could set up chronograf or even query the raw data. I posted instructions on how to do this some time ago, but would have to look up the topic.

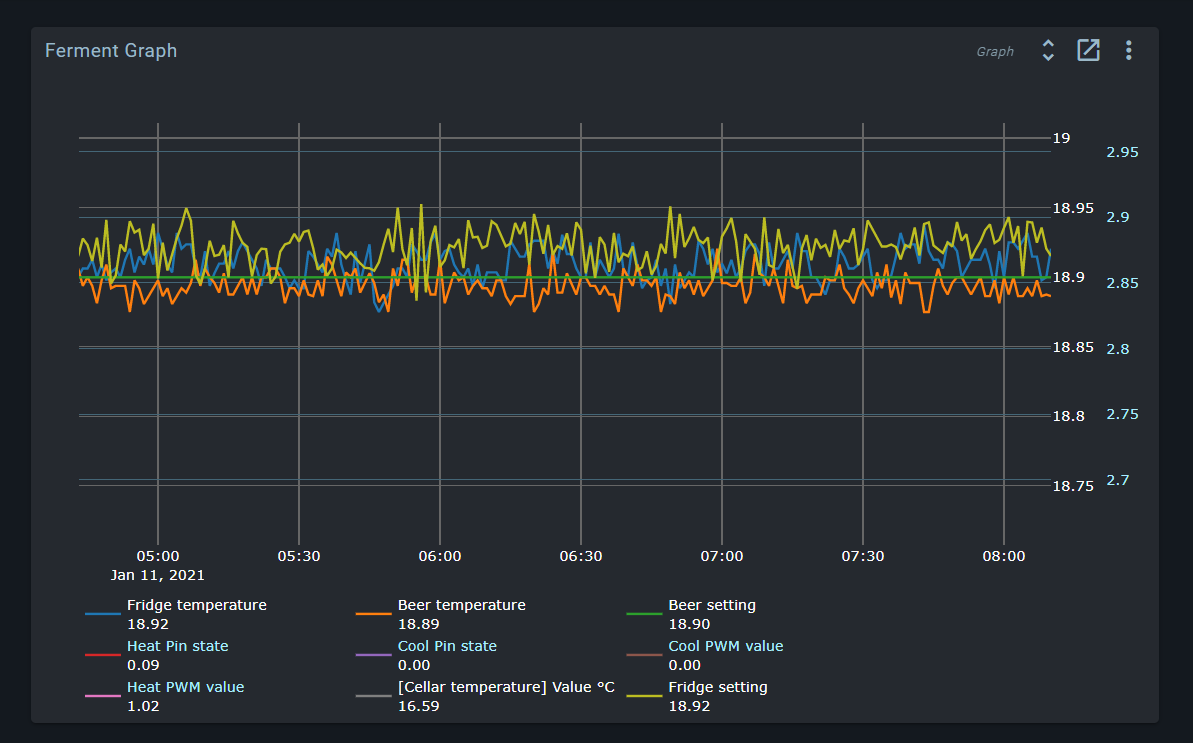
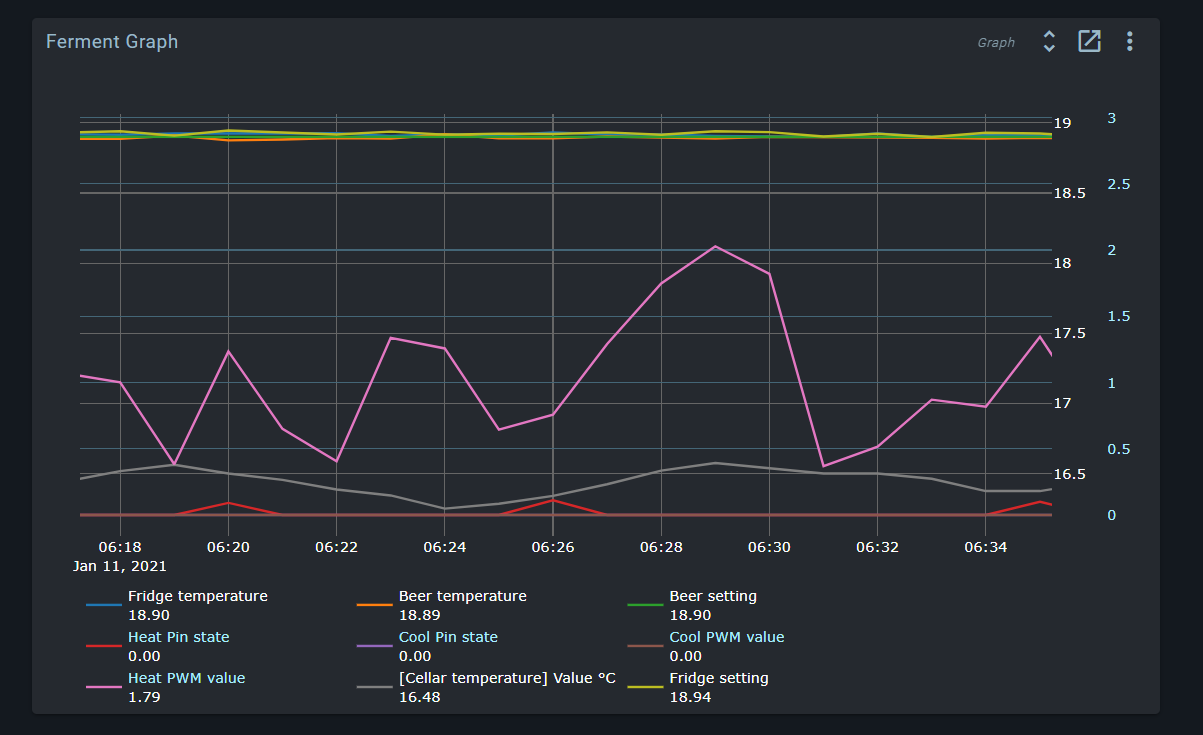
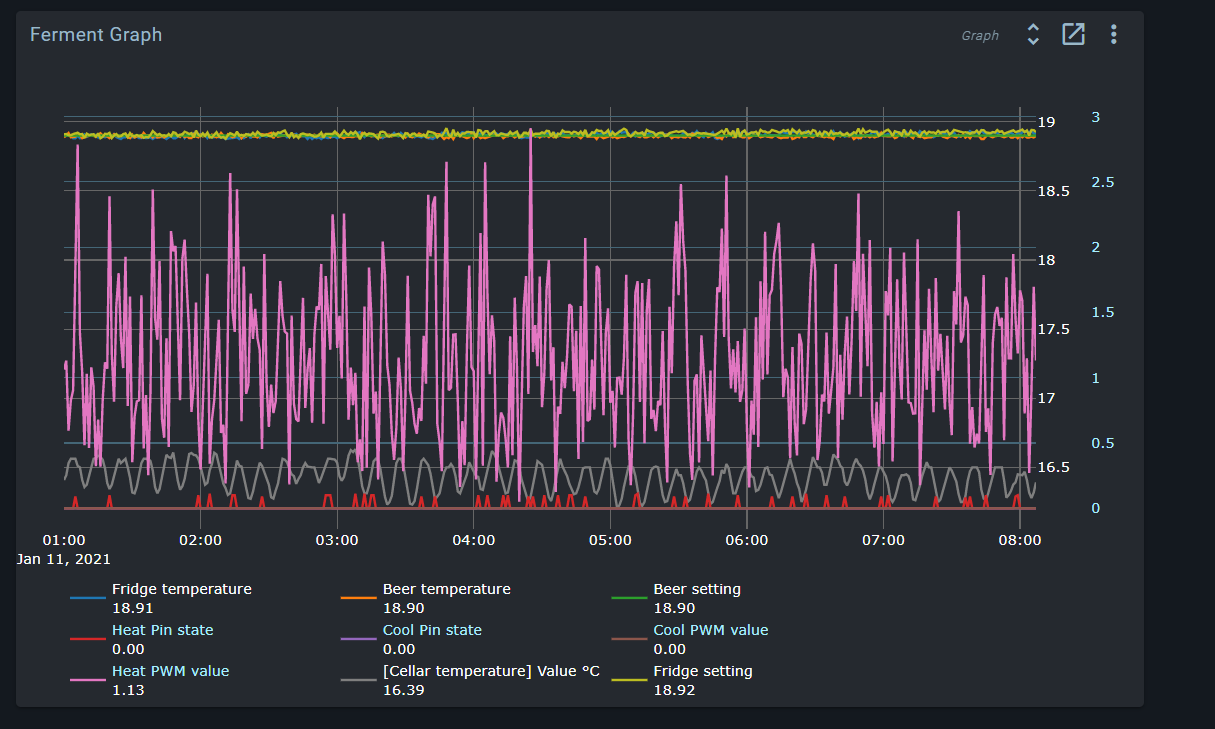
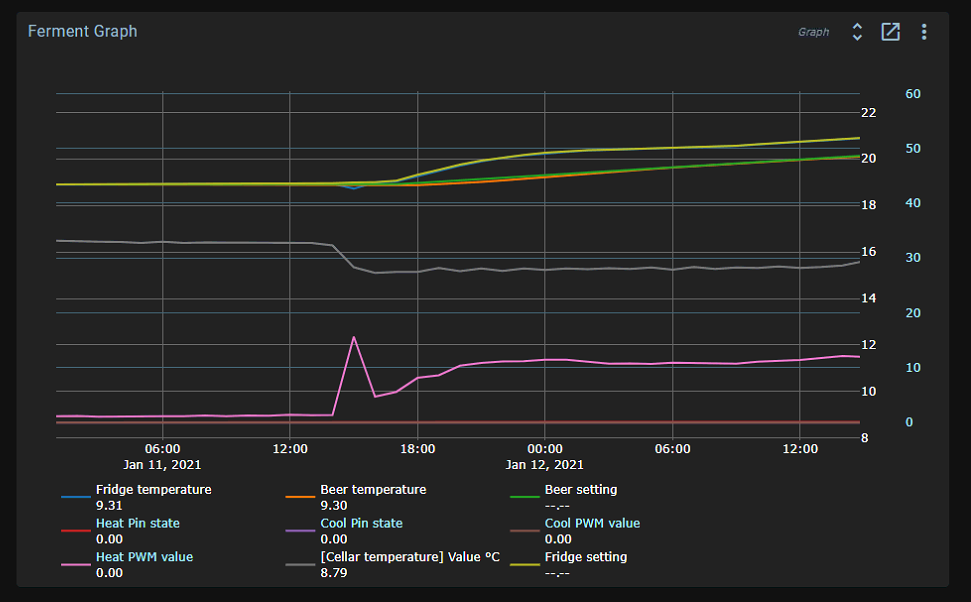
Raw sample rate for the Spark service is 5s, but this dataset is only kept for 24h.
Beyond this, we progressively downsample averaged values to multiple concurrent datasets (1m, 10m, 1h, 6h). These datasets are kept indefinitely.

When viewing a graph in the UI, the most appropriate dataset is selected based on available data. If you set the graph to show the last 10m, you’ll get realtime (5s) data, but if you show the last month, you’ll get data from either the 1h or the 6h dataset. If you select a 10m period from last week, you’ll get data from the 1m dataset.

CSV exports always use the 1m dataset because this is the highest resolution that is kept indefinitely.

Thank you for your excellent answers.

I will try to connect and disconnect the USB and see if the problem is repeatable.

I would be most grateful if you are able to dig out earlier information on chronograf and query.

Cheers

Instructions for accessing the CLI or installing chronograf can be found here: Advanced metrics

For documentation on the Influx query language, see https://docs.influxdata.com/influxdb/v1.8/query_language/explore-data/

I see that the data logging starts at precisely midnight UTC. This is not the moment when I disconnected the USB. Could there be some refresh working here?

Which dataset are you looking at, and from where?

If you are using the UI, you can see the currently used dataset in the graph widget settings.

The exact time leads me to believe that you’re looking at a 1h or 6h dataset, and data logging was interrupted <1h or <6h before midnight.

For example, if the Spark disconnected at 20:00, there would still be a 6h point inserted at 00:00, containing the average of values published between 18:00 and 20:00.

Here are screen captures of the graph set for 30d. Fermenting started Jan. 8. 17:24.The fermentation process worked as it should, but with no data logged before Jan. 11. 01:00 = 00:00 UTC.
I ran a log, termin = 4x17.

If you set the grah duration for something silly like 300d, does it show a gap, or still only data starting from 11/1?

Practically speaking, is your primary desire to recover data from before this date, or to make sure the system now works as intended?

My primary concern is to try to understand what happened so I may learn how to avoid problems in the future.
I have looked back into test runs from this fall and they are well logged. The data-gap lies in the period after turn-on on Jan. 7. or 8. and up to Jan. 11. 01:00.
If I see this same problem in the future: is there anything I should record for you then and there?

At a guess, the gap in logged data is due to the disrupted connection between controller and service.

The controller autonomously manages brew temperature, but does not record history data. The service polls the controller every few seconds while connected, and broadcasts the response.
The history service is subscribed to this broadcast, and sends the data to the database.

The full chain of data is spark controller -> spark service -> eventbus service -> history service -> history database. Any of them being offline or unable to connect to its peers will lead to missing history data.

Practically speaking, the connection between spark controller and service is the most fragile. The others all live on the Pi, and are not affected by wifi connectivity.

Running brewblox-ctl log always is a good idea. If we encounter more useful sources of information, we’ll add them to this command.

The UI will show whether the service is currently connected, but you can also manually check the service logs with docker-compose logs spark-one.

Hi
I ran an update. During the process a red flag came up saying “history connection closed, retrying”. There didn’t seem to be more problems after that. I reran the update and got the same message. Do I have a problem?

No, this is not a problem. The update stopped the history service, and the UI notified you that when the service was stopped, it lost connection.