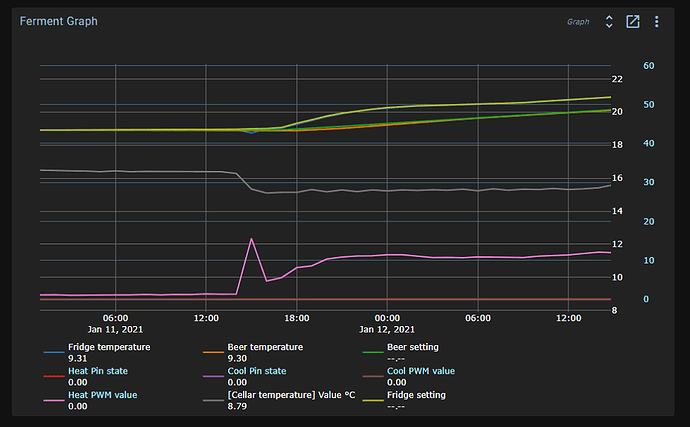
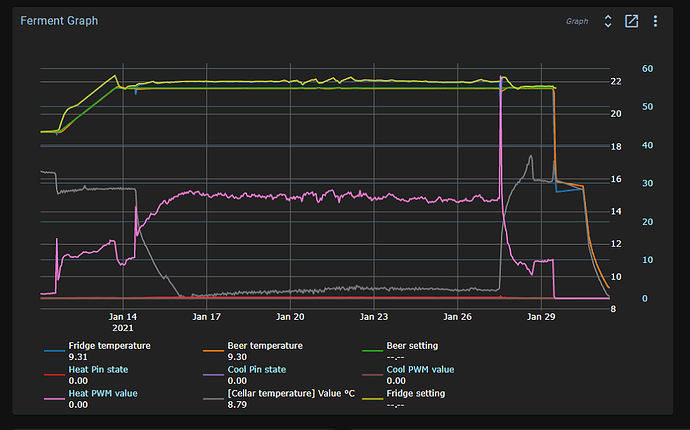
Note that the resolution of the sensor is 0.0625 degrees Celsius. But you are really at the limit of the sensor precision of 16 steps per degree.
If you look at a chart with a small time span, you’ll see the bit flips. For longer periods, the time series database averages the data into sparser samples. That’s why you see fluctuations between 18.9 and 18.95. The sensor will give you 18.875 or 18.9375.
50% chance of both if the temperature is exactly between them. Your setpoint is exactly between these two. So flickering between them is actually the perfect result and we cannot do any better!
Because a filter does a weighted average of values, increasing the filtering will also introduce a delay in the measurement. The PID uses the filtered signal.
The fridge temperature is fast changing, so you don’t want to introduce too much delay. Something under 5 minutes. For the beer temperature, you can use a bit more.
More filtering gives a smoother signal at the cost of a delay in response and possible overshoot.
Try a bit more filtering, but not too much. You cannot get a tighter control than this, just prettier lines.

