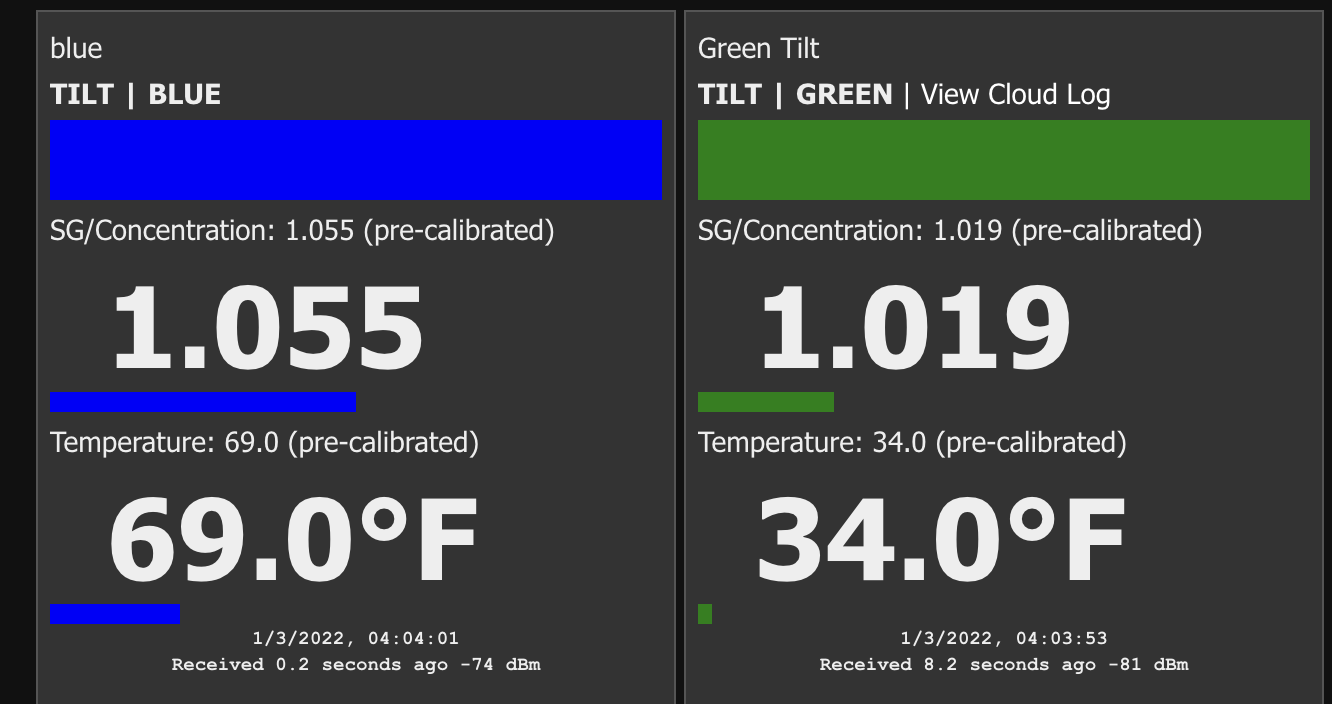
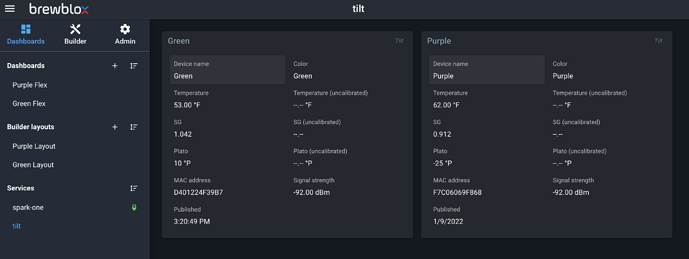
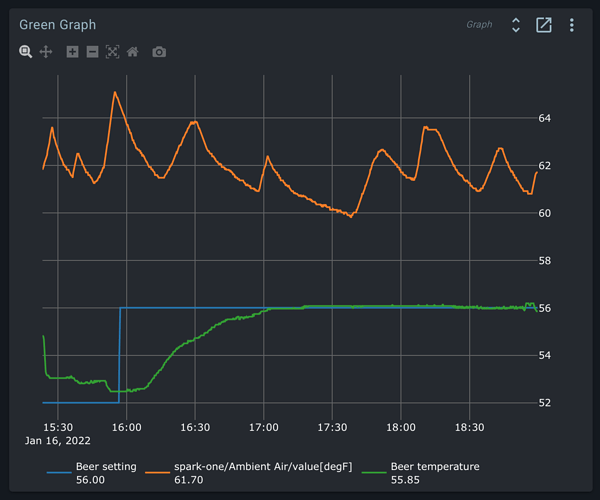
After getting the Tilt Service loaded and functioning, I’m having problems with calibration. I calibrated my Tilt to a floating glass hydrometer, and updated the SGCal.csv. That file looks like this:
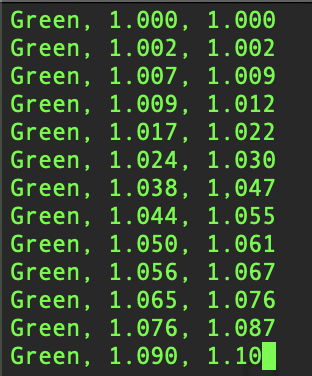
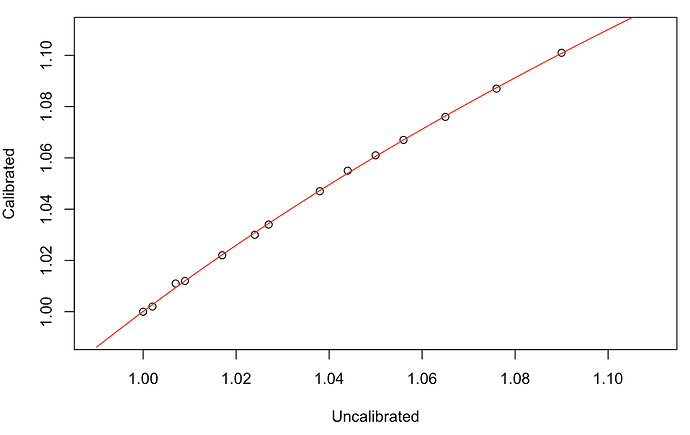
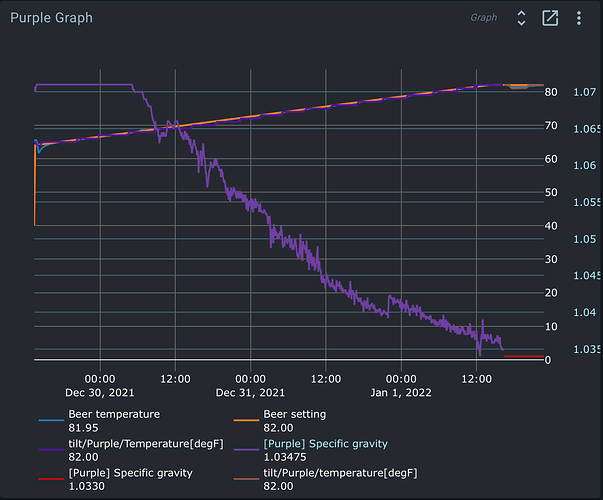
As you can see, my Tilt is accurate at low gravity, and loses accuracy by up to 11 points as gravity increases. No big deal, that’s what calibration is for! However, when I reload the Tilt service, my Calibrated SG value in the UI is saying 1.004 when the Tilt is floating in a glass of water. Something doesn’t seem to be correct in the logic of reporting calibrated values. I dug through the python code to see if I could learn how calibration is performed, and found the cubic polynomial interpolation. I wrote a small python script to calculate my calibration coefficients and predict SG values based on a user-supplied raw value. This logic works and is not the issue. I get correct calibrated values out of this little model, which do not match what my Tilt service is reporting in the UI. That is far as I could get, since I understand numpy much better than how values are reported to the UI. Anyhow, here is the little model I made to test my calibration:
import numpy as np

# x = uncalibrated value, y = calibrated value
x = np.array([1.00, 1.002, 1.007, 1.009, 1.017, 1.024, 1.027, 1.038, 1.044, 1.050, 1.056, 1.065, 1.076, 1.090])
y = np.array([1.00, 1.002, 1.011, 1.012, 1.022, 1.030, 1.034, 1.047, 1.055, 1.061, 1.067, 1.076, 1.087, 1.101])

# the cubic polynomial function:
z = np.polyfit(x,y,3)

while True:
    value = input("enter an uncalibrated SG value: ")
    if value == '':
        break
    # The calibrated value based on the raw value entered by the user:
    cal = round(np.poly1d(z)(float(value)), 3)
    print(f'Calibrated Value = {cal}')
I also did something similar in R:
range <- seq(from=0.99, to=1.110, by=0.001)

x <- c(1.00, 1.002, 1.007, 1.009, 1.017, 1.024, 1.027, 1.038, 1.044, 1.050, 1.056, 1.065, 1.076, 1.090)
y <- c(1.00, 1.002, 1.011, 1.012, 1.022, 1.030, 1.034, 1.047, 1.055, 1.061, 1.067, 1.076, 1.087, 1.101)

plot(range, range, type = 'n',xlab = "Uncalibrated", ylab = "Calibrated")
points(x, y)

model <- lm(y ~ poly(x, 3))
p <- predict(model, data.frame(x=range))

lines(range,p, col='red')
R output:
