another one to say thanks!
i’ve got some test graphs going with water and ambient temperature… looks like i’m getting +/- 0.5c jumps on the temperature, is this rounding?
another one to say thanks!
i’ve got some test graphs going with water and ambient temperature… looks like i’m getting +/- 0.5c jumps on the temperature, is this rounding?
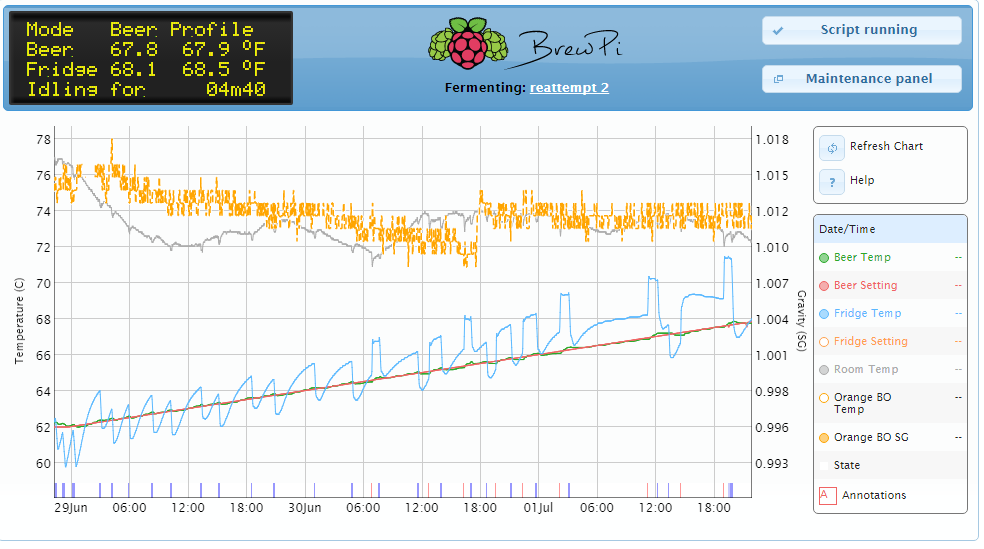
looking good! though i think you have labelled est og and est fg the wrong way around?
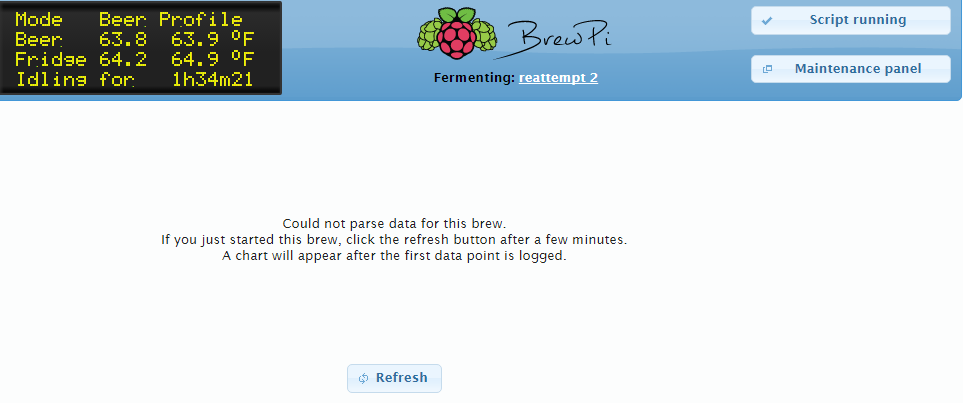
Hi all, any pointers on resolving an issue where there persistently is no graph and “can’t parse” error message?
Could not parse data for this brew.
If you just started this brew, click the refresh button after a few minutes.
A chart will appear after the first data point is logged.
Like jvgolf, I am running legacy branches as I’m using an Arduino. After realizing the hard way that sbowler’s code was off the main branch I manually ported the code over for the few files that change existing brewpi files. I think I got everything, but I’m stymied as to why the code isn’t recognizing the csv for the beer, which has data being logged to it (including gravity readings). I’ve tried starting a new brew to no avail.
Any pointers or ideas would be helpful.
@baseline: did you try starting a new brew? If you have data in the csv with and without Brewometer data then the graph won’t draw because there are more columns than data for some of the data points. Once I started a new beer, everything worked fine. (Edit: I see you did try starting a new beer)
If you see the Brewometer data in the csv file, it’s probably working properly.
Did you change the brewpiJson.py file too?
I have tired a new brew. Here is a screen shot of csv:
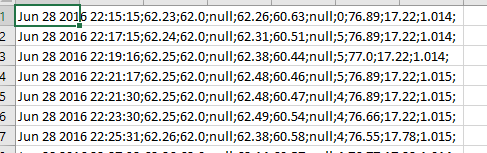
It looks like the gravity reading is there. I’ve double checked the changes I made to the script files and diff checker seems to suggest I got everything, but I might be missing something.
I’ve tried to focus on why the code thinks something wrong. I’ve located the code that throws the exception, its in
beer-chart.js around line 345.
$.post("get_beer_data.php", {"beername": beerToDraw}, function(answer) {
    var combinedJson = {};
  try{
        combinedJson = $.parseJSON(answer);
    } catch (e) {
        var $errorMessage = $("<span class='chart-error-text'>Could not parse data for this brew.<br>" +
            "If you just started this brew, click the refresh button after a few minutes.<br> " +
            "A chart will appear after the first data point is logged.</span>");
        var $refreshButton = $("<button class='chart-error-refresh'>Refresh</button>");
        $refreshButton.button({icons: {primary: "ui-icon-refresh" }}).click(function(){
            drawBeerChart(beerToDraw, div);
        });
The javascript and php code is beyond my depth. I’m trying to reading up on this but still at a loss. Something is wrong between get_beer_data.php and beer-chart.js. Any guidance folks might have would be much appreciated. In the meanwhile I’ll be slogging through tutorials.
What is the error message you are getting?
I finally ran down my issue, I was missing a critical comma, and not looking closely enough at the diffchecker. Up and working. This is awesome!
Howdy @lpgeek, This appears to be the accuracy of the brewometer - I also get the 0.5C jumps. The quoted accuracy is +/- 1C
Ha @basline - Your graph points out a bug/mistake on my behalf… Thinking that everyone was using Celsius. I’ll look at fixing both the graph and having it as a configuration file setting for the logging.
Great that you were able to get it working on your Arduino.
the accuracy is the amount it can vary, right?
both the app, your test script, and the json data are showing resolution to two decimal places… that’s why i was thinking rounding was in play
Just looking at the raw Brewometer output, the 0.5C jumps are due to the Fahrenheit conversion. The Brewometers output the temperature in F with no decimals (i.e 68F). so the accuracy resolution is at most 1F, but quoted is +/- 2F. This means that the measured value should be within +/- 2F of the actual.
fahrenheit conversion makes sense, cheers 
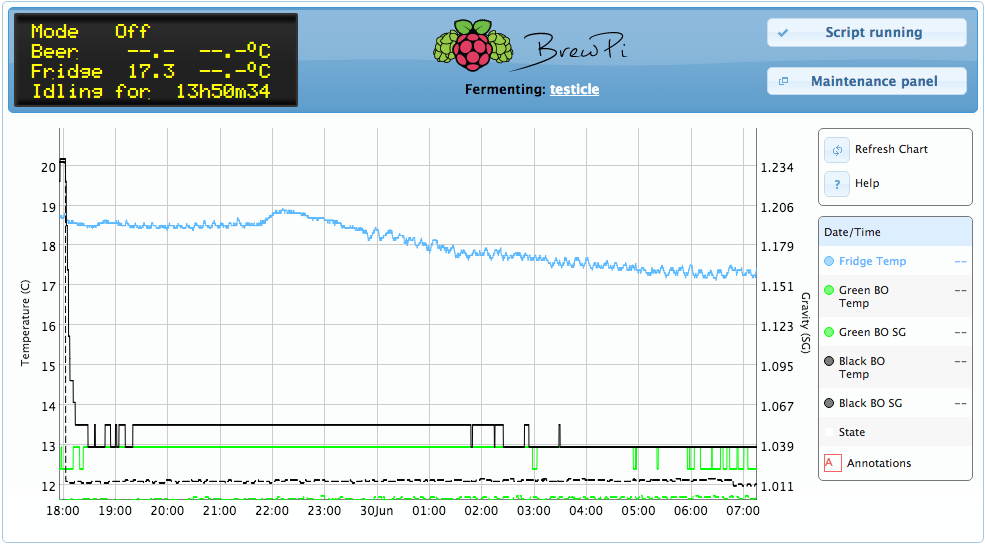
got through my first active fermentation capturing data… still no chamber to control the temps yet, as the ideal old freezer is seeming to elude me at the moment
@Elco - I know that you’ve got your own plans for an SG sensor. Is there any ways that this mod could be structured differently to enable it to be incorporated in the mainline?
We are working on an entire new server stack, with different data logging, different UI and different charts. I would not worry about forward compatibility now. We’ll make it easy to integrate other sensors in the new UI.
OK. If it’s factored in than that’s great.
i’d asked the same question of elco, too… really looking forward to the new architecture…
btw, i got enthused and learned myself a wee bit of d3.js -> http://mslcarew.com/brewpi/
clearly still trying to find an old freezer that suits my purposes! 
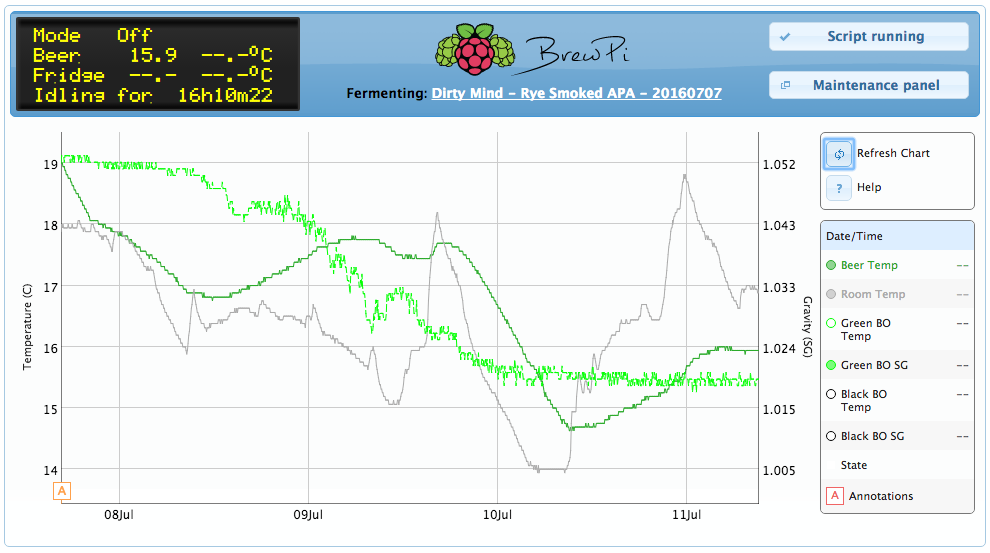
Have this installed and working. Planning to run a test batch of ginger beer and killing the fermentation at a certain gravity…awesome to see a trend of the gravity. One problem I see…the BO gravity does not zoom in properly. The secondary axis changes values, but the line seems to stay in one place vertically. (On iPad) On a computer it seems to be perfect.
I’ve observed something similar on Android. Unfortunately it’s a limitation of the graphing library.
@Elco is in the process of upgrading the frontend and I believe he is looking at a different graphing library, so we’ll see if that performs better on mobile devices.
I set this up running on a Pi 2 with Bluetooth dongle and @sbowler 's Brewometer code, great effort, thank you so much for this. The fermenter is not in my home so internet access is through a wifi 3G Dongle and password protected site.
Everything worked fine for about ten days, when the temperature / gravity graph stopped displaying on mobile devices, but it worked on my desktop.
Now after about 14 days it has stopped working on the desktop too. The lcd and header appears, the profile settings too, but no graph. I had set logging to once a minute, but maybe still too much data being generated? Anyone else experienced this and come up with a solution?
I think what’s happening is the amount of log data being returned to the mobile devices is too much for them to handle efficiently. I’ve seen similar on my mobile devices but if I wait long enough, the graph does display. I would hazard a guess that if you left the device on for 5 mins, it would eventually display the graph. This problem is the same with your desktop. I believe if you leave it long enough, the graph should display.
The solution? @Elco’s working on a new graphing mechanism which will return less data depending on the zoom level. So when you’ve got 10+ days of log data, it would only return the ‘highlights’ over the 10 days, until you zoom in on a day… Currently you will get every single datapoint over the 10 days returned.